Space Jam Viewer Demographics in United States
Space Jam has an estimated audience of 1.4M people in United States.
The average Space Jam fan in United States is 34.9 years old, more male, and lives primarily in California.
Interest is seasonal: July, August and September account for 53% of the year's searches, December is the quietest month.
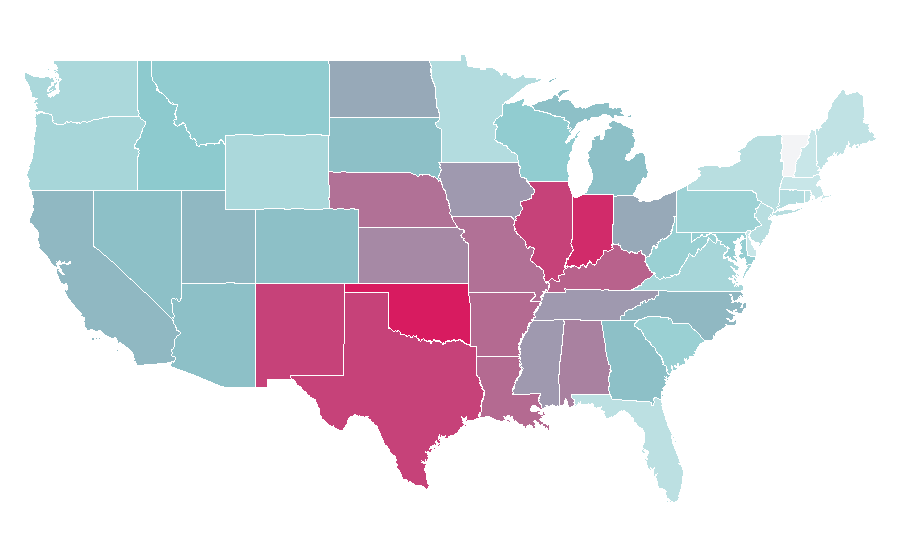
Most fans live in California, Texas, Florida.
Top affinities include The Adventures of Tintin, The Great Mouse Detective, The Rescuers, with strongest over-indexing on The Adventures of Tintin (150.83× the country average).
Demographically, the Space Jam audience skews more male with an average age of 34.9, and over-indexes on personality traits such as Spirituality, Early Adopter Mentality.
The typical Space Jam fan in United States is more male, around 34.9 years old, with strong Spirituality tendencies and a notable affinity for The Adventures of Tintin.
At a glance
Search interest · 12-month trend
Demographics of Space Jam viewers
39.9% are female, 60.1% are male, average age 34.9.
Gender split
| Metric | Value |
|---|---|
| Female | 39.9% |
| Male | 60.1% |
| Average age | 34.9 |
| Estimated audience size | 1.4M |
Age distribution
| Age bracket | Share | % |
|---|---|---|
| 16-24 | 24% | |
| 25-34 | 28% | |
| 35-44 | 28% | |
| 45-54 | 13% | |
| 55+ | 8% |
Worldwide distribution
of the worldwide Space Jam audience comes from United States.
| Country | Share |
|---|---|
| United States | 40.1% |
| Brazil | 7.0% |
| Italy | 5.8% |
Geography
Top regions by affinity
| # | Region | Reach | Affinity | × |
|---|---|---|---|---|
| 01 | Oklahoma | ~20K | 1.23× | |
| 02 | Indiana | ~30K | 1.21× | |
| 03 | Texas | ~100K | 1.18× | |
| 04 | Illinois | ~60K | 1.18× | |
| 05 | New Mexico | ~10K | 1.18× | |
| 06 | Kentucky | ~20K | 1.14× | |
| 07 | Louisiana | ~20K | 1.13× | |
| 08 | Arkansas | ~10K | 1.13× | |
| 09 | Missouri | ~30K | 1.12× | |
| 10 | Nebraska | ~9K | 1.12× | |
| 11 | Alabama | ~20K | 1.10× | |
| 12 | Kansas | ~10K | 1.09× | |
| 13 | Tennessee | ~30K | 1.07× | |
| 14 | Iowa | ~10K | 1.07× | |
| 15 | Mississippi | ~10K | 1.07× | |
| 16 | Ohio | ~50K | 1.05× | |
| 17 | North Dakota | ~3K | 1.05× | |
| 18 | California | ~200K | 1.03× | |
| 19 | North Carolina | ~50K | 1.03× | |
| 20 | Utah | ~10K | 1.03× | |
| 21 | Georgia | ~50K | 1.02× | |
| 22 | Michigan | ~40K | 1.02× | |
| 23 | Arizona | ~30K | 1.02× | |
| 24 | Colorado | ~20K | 1.02× | |
| 25 | Nevada | ~10K | 1.02× | |
| 26 | South Dakota | ~4K | 1.02× | |
| 27 | Idaho | ~8K | 1.00× | |
| 28 | Wisconsin | ~20K | 0.99× | |
| 29 | Montana | ~4K | 0.99× | |
| 30 | Maryland | ~30K | 0.98× | |
| 31 | South Carolina | ~20K | 0.97× | |
| 32 | West Virginia | ~7K | 0.97× | |
| 33 | Pennsylvania | ~50K | 0.96× | |
| 34 | Virginia | ~30K | 0.94× | |
| 35 | Oregon | ~20K | 0.94× | |
| 36 | Washington | ~30K | 0.93× | |
| 37 | Wyoming | ~2K | 0.93× | |
| 38 | Alaska | ~3K | 0.92× | |
| 39 | Minnesota | ~20K | 0.91× | |
| 40 | Connecticut | ~10K | 0.91× | |
| 41 | New York | ~80K | 0.90× | |
| 42 | New Jersey | ~30K | 0.90× | |
| 43 | Florida | ~80K | 0.89× | |
| 44 | Rhode Island | ~4K | 0.89× | |
| 45 | Maine | ~5K | 0.88× | |
| 46 | Massachusetts | ~30K | 0.86× | |
| 47 | New Hampshire | ~5K | 0.86× | |
| 48 | Delaware | ~4K | 0.86× | |
| 49 | Washington, District of Columbia | ~2K | 0.81× | |
| 50 | Hawaii | ~5K | 0.79× |
Affinity by region
Audience interests & affinities
Top cross-interests, ranked by affinity
| # | · | Interest | Category | Affinity | × |
|---|---|---|---|---|---|
| 01 | The Adventures of Tintin | Literature | 150.83× | ||
| 02 | The Great Mouse Detective | Movies & TV | 117.42× | ||
| 03 | The Rescuers | Movies & TV | 114.27× | ||
| 04 | Stuart Little (film) | Movies & TV | 94.05× | ||
| 05 | The Secret Life Of Pets | Movies & TV | 93.37× | ||
| 06 | Thomas Middleditch | Movies & TV | 91.68× | ||
| 07 | Meet the Robinsons | Movies & TV | 87.95× | ||
| 08 | Lemony Snicket | Movies & TV | 85.67× | ||
| 09 | Megamind | Movies & TV | 79.14× | ||
| 10 | Lemony Snicket's A Series of Unfortunate Events | Movies & TV | 77.41× | ||
| 11 | Oliver & Company | Movies & TV | 66.14× | ||
| 12 | Groundhog Day (film) | Movies & TV | 59.50× | ||
| 13 | Teletubbies | Kids & Family | 53.86× | ||
| 14 | 101 Dalmatians (1996 film) | Movies & TV | 51.70× | ||
| 15 | Curious George (TV series) | Movies & TV | 48.01× | ||
| 16 | Zootopia | Movies & TV | 37.77× | ||
| 17 | Remember the Titans | Movies & TV | 33.74× | ||
| 18 | Dumbo | Movies & TV | 26.17× | ||
| 19 | Minions (film) | Movies & TV | 25.85× | ||
| 20 | Brave (2012 film) | Movies & TV | 21.58× |
Personality of the Space Jam audience
Deviation from the national baseline
| Trait | Cluster | Deviation | Score |
|---|---|---|---|
| Spirituality | BALANCE | 1.19× | |
| Early Adopter Mentality | POWER | 1.17× | |
| Social Media Usage | JOY | 1.14× |
| Trait | Cluster | Deviation | Score |
|---|---|---|---|
| Design Affinity | PREMIUM | 0.85× | |
| Luxury Orientation | PREMIUM | 0.87× | |
| Quality Awareness | PREMIUM | 0.95× |
Explore more audiences
More Movies & TV audiences in United States
- Harry Potter (53,268,080)
- Stranger Things (35,325,845)
- Cars (film) (31,584,209)
Source & method
- Source
- Rascasse Solution, own modelling
- What “fans” means here
- Estimated number of people in United States with measurable interest in Space Jam over the last 12 months. Modelled, not counted; people interested in several movie / tv show / seriess count for each of them.
- Data basis
- Anonymised behavioural signals: search demand, social media signals, sponsorship and event data. Not a survey.
- Period
- 10/2025 – 09/2026 · updated quarterly · data status Q3/2026
- Confidence
- high gender and age data available and an audience of at least 100,000 people
Cite as: “Rascasse Solution, Q3/2026, rascasse.com/explore/us/space-jam-44120” · Methodology