Star Trek Viewer Demographics in United States
Star Trek has an estimated audience of 4.8M people in United States.
The average Star Trek fan in United States is 41.4 years old, more male, and lives primarily in California.
By number of fans, Star Trek ranks #10 among the 103 objects in Science Fiction & Fantasy in United States — 5.7× the group median.
Its fans are 6.0 years older than the group average of 35.4.
Women make up 34.8% of the fan base, 6.2 percentage points fewer than the group average.
Compared with the other 102 objects in Science Fiction & Fantasy, Star Trek fans stand out for their interest in Star Trek: The Next Generation, Over the Hedge (film) and Star Trek: The Original Series.
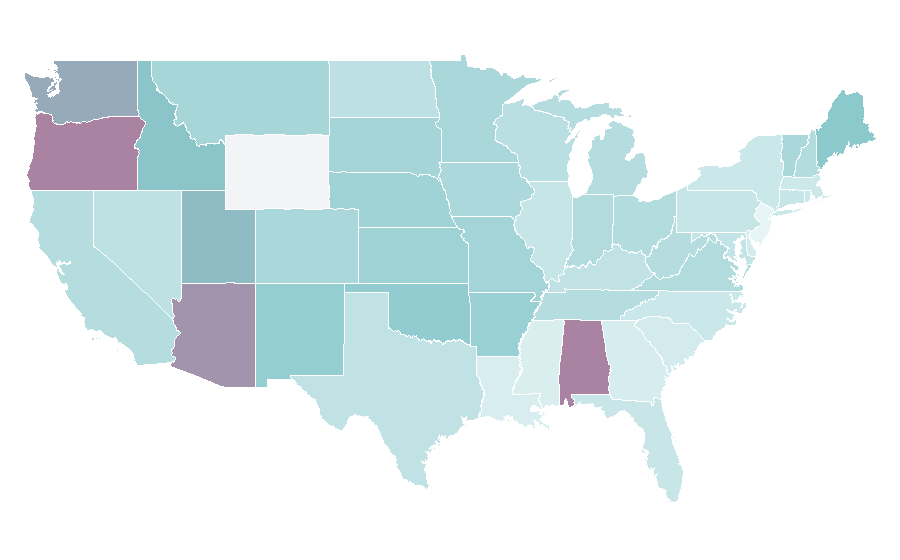
Most fans live in California, Texas, Florida.
Top affinities include Star Trek: The Next Generation, Over the Hedge (film), Star Trek: The Original Series, with strongest over-indexing on Star Trek: The Next Generation (16.26× the country average).
Demographically, the Star Trek audience skews more male with an average age of 41.4, and over-indexes on personality traits such as Patriotism, Early Adopter Mentality.
The typical Star Trek fan in United States is more male, around 41.4 years old, with strong Patriotism tendencies and a notable affinity for Star Trek: The Next Generation.
At a glance
Search interest · 12-month trend
Demographics of Star Trek viewers
34.8% are female, 65.2% are male, average age 41.4.
Gender split
| Metric | Value |
|---|---|
| Female | 34.8% |
| Male | 65.2% |
| Average age | 41.4 |
| Estimated audience size | 4.8M |
Age distribution
| Age bracket | Share | % |
|---|---|---|
| 16-24 | 20% | |
| 25-34 | 15% | |
| 35-44 | 18% | |
| 45-54 | 21% | |
| 55+ | 25% |
Worldwide distribution
of the worldwide Star Trek audience comes from United States.
| Country | Share |
|---|---|
| United States | 34.8% |
| Germany | 10.3% |
| United Kingdom | 7.2% |
Geography
Top regions by affinity
| # | Region | Reach | Affinity | × |
|---|---|---|---|---|
| 01 | Alaska | ~20K | 1.56× | |
| 02 | Alabama | ~100K | 1.32× | |
| 03 | Oregon | ~80K | 1.32× | |
| 04 | Arizona | ~100K | 1.28× | |
| 05 | Washington | ~100K | 1.23× | |
| 06 | Utah | ~60K | 1.19× | |
| 07 | Idaho | ~30K | 1.17× | |
| 08 | Maine | ~20K | 1.15× | |
| 09 | Oklahoma | ~60K | 1.12× | |
| 10 | New Mexico | ~30K | 1.11× | |
| 11 | Arkansas | ~50K | 1.09× | |
| 12 | Kansas | ~50K | 1.07× | |
| 13 | Nebraska | ~30K | 1.06× | |
| 14 | Missouri | ~90K | 1.05× | |
| 15 | South Dakota | ~10K | 1.04× | |
| 16 | Montana | ~20K | 1.03× | |
| 17 | Colorado | ~80K | 1.02× | |
| 18 | Minnesota | ~80K | 1.02× | |
| 19 | Vermont | ~9K | 1.02× | |
| 20 | Iowa | ~50K | 1.01× | |
| 21 | Virginia | ~100K | 0.99× | |
| 22 | Indiana | ~100K | 0.99× | |
| 23 | Ohio | ~200K | 0.98× | |
| 24 | Hawaii | ~20K | 0.98× | |
| 25 | New Hampshire | ~20K | 0.98× | |
| 26 | California | ~600K | 0.97× | |
| 27 | Michigan | ~100K | 0.97× | |
| 28 | Tennessee | ~100K | 0.97× | |
| 29 | West Virginia | ~30K | 0.97× | |
| 30 | Wisconsin | ~80K | 0.95× | |
| 31 | North Dakota | ~10K | 0.94× | |
| 32 | Nevada | ~40K | 0.93× | |
| 33 | Texas | ~300K | 0.92× | |
| 34 | Kentucky | ~60K | 0.92× | |
| 35 | Maryland | ~80K | 0.91× | |
| 36 | Pennsylvania | ~200K | 0.90× | |
| 37 | Illinois | ~200K | 0.90× | |
| 38 | Connecticut | ~50K | 0.90× | |
| 39 | Florida | ~300K | 0.89× | |
| 40 | New York | ~300K | 0.88× | |
| 41 | North Carolina | ~100K | 0.88× | |
| 42 | Rhode Island | ~10K | 0.88× | |
| 43 | Massachusetts | ~90K | 0.87× | |
| 44 | Washington, District of Columbia | ~8K | 0.85× | |
| 45 | South Carolina | ~70K | 0.84× | |
| 46 | Delaware | ~10K | 0.84× | |
| 47 | Georgia | ~100K | 0.83× | |
| 48 | Louisiana | ~50K | 0.82× | |
| 49 | Mississippi | ~30K | 0.81× | |
| 50 | New Jersey | ~100K | 0.76× |
Affinity by region
Audience interests & affinities
Top cross-interests, ranked by affinity
| # | · | Interest | Category | Affinity | × |
|---|---|---|---|---|---|
| 01 | Star Trek: The Next Generation | Movies & TV | 16.26× | ||
| 02 | Over the Hedge (film) | Movies & TV | 14.51× | ||
| 03 | Star Trek: The Original Series | Movies & TV | 12.77× | ||
| 04 | Patrick Stewart | Movies & TV | 12.40× | ||
| 05 | Star Trek (film) | Movies & TV | 12.21× | ||
| 06 | Mickey Mouse Clubhouse | Movies & TV | 11.41× | ||
| 07 | William Shatner | Movies & TV | 9.50× | ||
| 08 | Dick Van Dyke | Movies & TV | 3.49× | ||
| 09 | Rob Reiner | Movies & TV | 3.04× | ||
| 10 | Walt Disney World | Travel & Leisure | 2.73× | ||
| 11 | Hollywood | Travel & Leisure | 2.63× | ||
| 12 | Recreation | Travel & Leisure | 2.61× | ||
| 13 | Earth | Travel & Leisure | 2.49× | ||
| 14 | Harry Potter | Movies & TV | 2.44× | ||
| 15 | Televisions | Technology & Electronics | 2.19× | ||
| 16 | Books | Literature | 1.90× | ||
| 17 | Rock music | Music & Radio | 1.87× | ||
| 18 | Nature | Home & Garden | 1.79× | ||
| 19 | Computers | Technology & Electronics | 1.58× | ||
| 20 | Outdoor recreation | Sports | 1.52× |
Personality of the Star Trek audience
Deviation from the national baseline
| Trait | Cluster | Deviation | Score |
|---|---|---|---|
| Patriotism | CONSERVATISM | 1.71× | |
| Early Adopter Mentality | POWER | 1.37× | |
| Need for Security | CONSERVATISM | 1.22× |
| Trait | Cluster | Deviation | Score |
|---|---|---|---|
| Quality Awareness | PREMIUM | 0.77× | |
| Luxury Orientation | PREMIUM | 0.79× | |
| Price Sensitivity | PREMIUM | 0.85× |
Explore more audiences
More Science Fiction & Fantasy audiences in United States
- Star Wars (15,242,920)
- Twilight (series) (7,715,305)
See Star Trek audiences in other countries
Source & method
- Source
- Rascasse Solution, own modelling
- What “fans” means here
- Estimated number of people in United States with measurable interest in Star Trek over the last 12 months. Modelled, not counted; people interested in several movie / tv show / seriess count for each of them.
- Data basis
- Anonymised behavioural signals: search demand, social media signals, sponsorship and event data. Not a survey.
- Period
- 10/2025 – 09/2026 · updated quarterly · data status Q3/2026
- Confidence
- high gender and age data available and an audience of at least 100,000 people
Cite as: “Rascasse Solution, Q3/2026, rascasse.com/explore/us/star-trek-4611” · Methodology