Architecture & Engineering Audience in United States
A data profile of the people who buy, follow and care about Architecture & Engineering in United States — modelled from more than twelve digital signal sources. Architecture & Engineering has an estimated audience of 697,473 people in United States.
The average Architecture & Engineering fan in United States is 34.8 years old, balanced, and lives primarily in Texas.
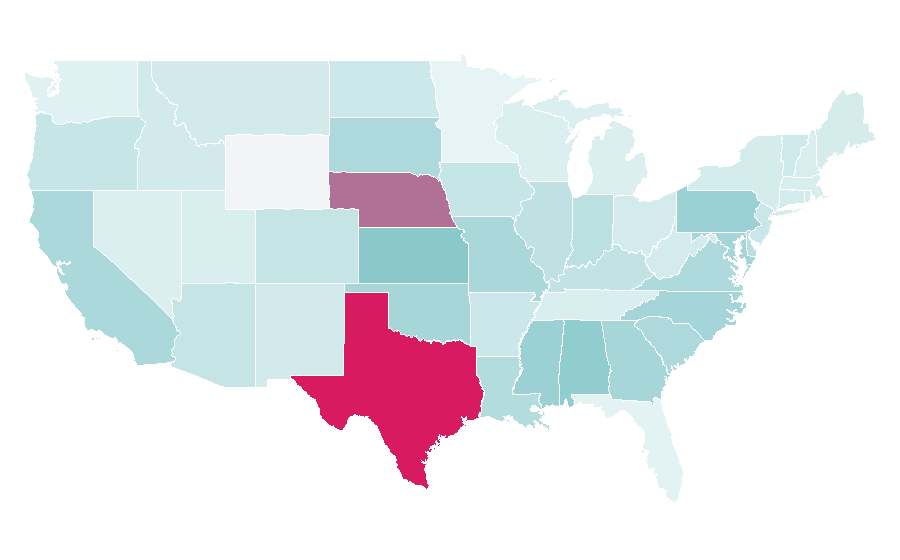
The audience is concentrated in Texas, California, Florida.
At a glance
The key figures that characterise the Architecture & Engineering profile in United States.
Search interest · 12-month trend
Demographics of Architecture & Engineering fans
45.5% are female, 54.5% are male, average age 34.8.
Gender split
| Metric | Value |
|---|---|
| Female | 45.5% |
| Male | 54.5% |
| Average age | 34.8 |
| Estimated audience size | 697,473 |
Age distribution
| Age bracket | Share | % |
|---|---|---|
| 16-19 | 29% | |
| 20-29 | 24% | |
| 30-39 | 20% | |
| 40-49 | 16% | |
| 50+ | 12% |
Geography
Where the Architecture & Engineering audience in United States is strongest.
Top regions by affinity
| # | Region | Reach | Affinity | × |
|---|---|---|---|---|
| 01 | Texas | ~100K | 1.88× | |
| 02 | Nebraska | ~6K | 1.61× | |
| 03 | Kansas | ~7K | 1.33× | |
| 04 | Alabama | ~10K | 1.29× | |
| 05 | Pennsylvania | ~30K | 1.23× | |
| 06 | Mississippi | ~7K | 1.23× | |
| 07 | North Carolina | ~20K | 1.17× | |
| 08 | Maryland | ~10K | 1.17× | |
| 09 | Georgia | ~20K | 1.16× | |
| 10 | Oklahoma | ~9K | 1.16× | |
| 11 | Missouri | ~10K | 1.15× | |
| 12 | California | ~90K | 1.14× | |
| 13 | Hawaii | ~3K | 1.14× | |
| 14 | South Carolina | ~10K | 1.12× | |
| 15 | South Dakota | ~2K | 1.12× | |
| 16 | Virginia | ~20K | 1.11× | |
| 17 | Louisiana | ~10K | 1.09× | |
| 18 | Delaware | ~2K | 1.06× | |
| 19 | Indiana | ~10K | 1.04× | |
| 20 | Illinois | ~20K | 1.02× | |
| 21 | Kentucky | ~9K | 1.00× | |
| 22 | Arizona | ~10K | 0.99× | |
| 23 | Colorado | ~10K | 0.99× | |
| 24 | Oregon | ~8K | 0.98× | |
| 25 | Iowa | ~6K | 0.98× | |
| 26 | New Jersey | ~20K | 0.96× | |
| 27 | Arkansas | ~5K | 0.95× | |
| 28 | Alaska | ~1K | 0.95× | |
| 29 | North Dakota | ~1K | 0.94× | |
| 30 | Vermont | ~1K | 0.93× | |
| 31 | Washington, District of Columbia | ~2K | 0.92× | |
| 32 | New Mexico | ~3K | 0.91× | |
| 33 | Idaho | ~3K | 0.91× | |
| 34 | Rhode Island | ~2K | 0.91× | |
| 35 | Montana | ~2K | 0.91× | |
| 36 | Ohio | ~20K | 0.90× | |
| 37 | Connecticut | ~6K | 0.90× | |
| 38 | West Virginia | ~3K | 0.90× | |
| 39 | New York | ~30K | 0.89× | |
| 40 | Maine | ~2K | 0.89× | |
| 41 | Massachusetts | ~10K | 0.88× | |
| 42 | New Hampshire | ~2K | 0.88× | |
| 43 | Tennessee | ~10K | 0.87× | |
| 44 | Utah | ~5K | 0.87× | |
| 45 | Michigan | ~20K | 0.85× | |
| 46 | Wisconsin | ~9K | 0.85× | |
| 47 | Nevada | ~6K | 0.85× | |
| 48 | Washington | ~10K | 0.83× | |
| 49 | Florida | ~40K | 0.81× | |
| 50 | Minnesota | ~8K | 0.79× |
Affinity by region
Explore more audiences
Related profiles, rankings and the same audience in other markets.
More Field of study audiences in United States
- Music (181,108,961)
- Politics and social issues (139,815,487)
- Education (104,984,855)
- Medicine (89,907,855)
- Psychology (89,088,191)
See Architecture & Engineering audiences in other countries
- Architecture & Engineering — Germany
- Architecture & Engineering — United Kingdom
- Architecture & Engineering — France
- Architecture & Engineering — Italy
- Architecture & Engineering — Spain
- Architecture & Engineering — Brazil
- Architecture & Engineering — Japan
- Architecture & Engineering — South Korea
- Architecture & Engineering — India
- Architecture & Engineering — Canada
- Architecture & Engineering — Mexico
How to read this data
Audience size is the estimated number of people in United States who actively search for Architecture & Engineering. Affinity is an over-index ratio: 2.0× means the audience is twice as likely to engage with that brand or trait as the country average. Reach is the estimated number of audience members in a region. Regional and brand-affinity tables are sorted from strongest signal to weakest.
About this audience profile
This audience profile is generated by Rascasse from anonymized search-behavior signals across United States. For methodology see methodology. Affinity values are over-index ratios vs. the country average (1.0 = baseline). Audience sizes are estimated, not measured.
From global mass-market brands to niche local segments — explore the full library and see which intelligence layers are included.