Rascasse Audience Intelligence
Nashville SC Fan Demographics in United States
Nashville SC has an estimated audience of 1.5M people in United States.
The average Nashville SC fan in United States is 41.3 years old, more male, and lives primarily in Tennessee.
Its fans are 7.5 years older than the group average of 33.8.
Women make up 32.8% of the fan base, 1.7 percentage points fewer than the group average.
Interest is seasonal: May, July and August account for 44% of the year's searches, December is the quietest month.
Most fans live in Tennessee, California, Florida.
At a glance
Audience size
1.5M
in United States
Gender
32.8%♀
67.2% male
Age
41.3
average years
Country rank
#18317
among all objects in United States
Fig. 01
Search interest · 12-month trend
+70%
vs. last year
Demographics of Nashville SC fans
32.8% are female, 67.2% are male, average age 41.3.
Fig. 02
Gender split
32.8%
Female
67.2%
Male
| Metric | Value |
|---|---|
| Female | 32.8% |
| Male | 67.2% |
| Average age | 41.3 |
| Estimated audience size | 1.5M |
Fig. 03
Age distribution
Ø 41.3
average years
| Age bracket | Share | % |
|---|---|---|
| 16-24 | 15% | |
| 25-34 | 18% | |
| 35-44 | 23% | |
| 45-54 | 24% | |
| 55+ | 20% |
Fig. 04
Worldwide distribution
34.7%
of the worldwide Nashville SC audience comes from United States.
| Country | Share |
|---|---|
| United States | 34.7% |
| Brazil | 9.8% |
| Indonesia | 6.5% |
Geography
Fig. 05
Top regions by affinity
| # | Region | Reach | Affinity | × |
|---|---|---|---|---|
| 01 | Tennessee | ~800K | 24.02× | |
| 02 | Kentucky | ~40K | 1.88× | |
| 03 | Alabama | ~30K | 1.22× | |
| 04 | Florida | ~80K | 0.88× | |
| 05 | Ohio | ~50K | 0.87× | |
| 06 | North Carolina | ~40K | 0.81× | |
| 07 | Mississippi | ~10K | 0.79× | |
| 08 | Alaska | ~2K | 0.74× | |
| 09 | Georgia | ~40K | 0.72× | |
| 10 | Rhode Island | ~3K | 0.70× | |
| 11 | Delaware | ~3K | 0.70× | |
| 12 | Vermont | ~2K | 0.70× | |
| 13 | New Jersey | ~30K | 0.68× | |
| 14 | North Dakota | ~2K | 0.67× | |
| 15 | Washington, District of Columbia | ~2K | 0.66× | |
| 16 | Indiana | ~20K | 0.65× | |
| 17 | South Dakota | ~3K | 0.65× | |
| 18 | Illinois | ~40K | 0.64× | |
| 19 | Maryland | ~20K | 0.63× | |
| 20 | South Carolina | ~20K | 0.63× | |
| 21 | Massachusetts | ~20K | 0.61× | |
| 22 | Montana | ~3K | 0.60× | |
| 23 | Virginia | ~20K | 0.59× | |
| 24 | Arkansas | ~8K | 0.59× | |
| 25 | New Hampshire | ~3K | 0.59× | |
| 26 | New York | ~50K | 0.58× | |
| 27 | Nebraska | ~5K | 0.55× | |
| 28 | Maine | ~3K | 0.55× | |
| 29 | California | ~100K | 0.54× | |
| 30 | West Virginia | ~4K | 0.54× | |
| 31 | Iowa | ~8K | 0.53× | |
| 32 | Kansas | ~7K | 0.52× | |
| 33 | Missouri | ~10K | 0.51× | |
| 34 | Connecticut | ~8K | 0.51× | |
| 35 | Idaho | ~4K | 0.51× | |
| 36 | Oregon | ~9K | 0.50× | |
| 37 | Hawaii | ~3K | 0.50× | |
| 38 | Pennsylvania | ~30K | 0.49× | |
| 39 | Nevada | ~7K | 0.48× | |
| 40 | New Mexico | ~4K | 0.48× | |
| 41 | Texas | ~50K | 0.46× | |
| 42 | Colorado | ~10K | 0.46× | |
| 43 | Washington | ~20K | 0.45× | |
| 44 | Louisiana | ~9K | 0.45× | |
| 45 | Utah | ~7K | 0.45× | |
| 46 | Arizona | ~10K | 0.43× | |
| 47 | Minnesota | ~10K | 0.42× | |
| 48 | Oklahoma | ~7K | 0.42× | |
| 49 | Wisconsin | ~10K | 0.39× | |
| 50 | Michigan | ~20K | 0.34× |
Fig. 06
Affinity by region
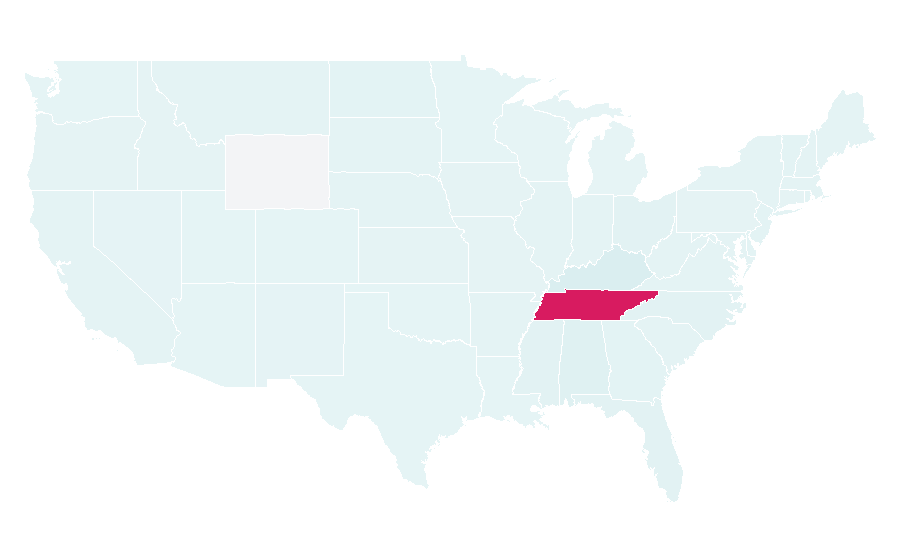
0.34×1.00×24.02×
Explore more audiences
More Soccer audiences in United States
- FIFA World Cup 2026 (251,250,000)
- FIFA World Cup (98,296,169)
- FC Barcelona (35,491,551)
- Lamine Yamal (25,893,905)
Source & method
- Source
- Rascasse Solution, own modelling
- What “fans” means here
- Estimated number of people in United States with measurable interest in Nashville SC over the last 12 months. Modelled, not counted; people interested in several teams count for each of them.
- Data basis
- Anonymised behavioural signals: search demand, social media signals, sponsorship and event data. Not a survey.
- Period
- 10/2025 – 09/2026 · updated quarterly · data status Q3/2026
- Confidence
- high gender and age data available and an audience of at least 100,000 people
Cite as: “Rascasse Solution, Q3/2026, rascasse.com/explore/us/nashville-sc-10009214” · Methodology