Brisbane Lions Audience in United States
A data profile of the people who buy, follow and care about Brisbane Lions in United States — modelled from more than twelve digital signal sources. Brisbane Lions has an estimated audience of 117,242 people in United States.
The average Brisbane Lions fan in United States is 33.0 years old, balanced, and lives primarily in California.
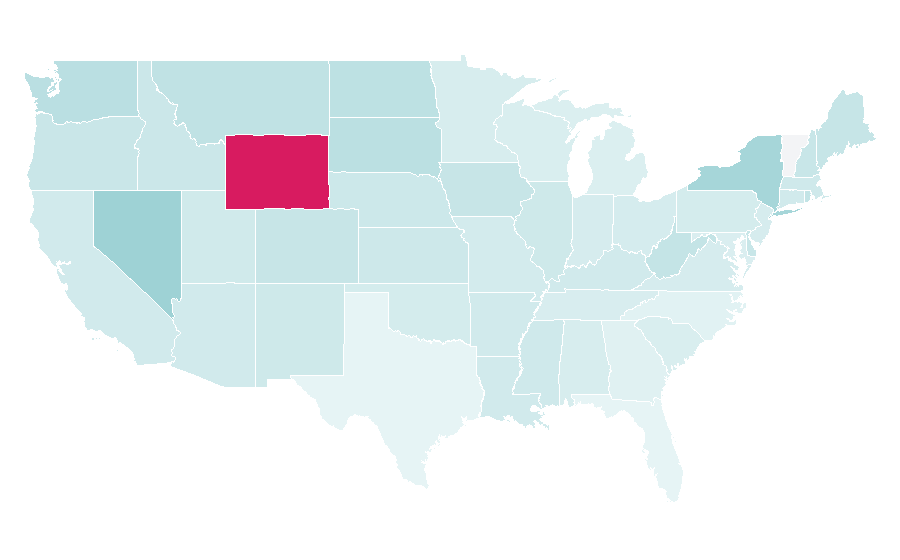
The audience is concentrated in California, New York, Texas.
At a glance
The key figures that characterise the Brisbane Lions profile in United States.
Search interest · 12-month trend
Demographics of Brisbane Lions fans
47.4% are female, 52.6% are male, average age 33.0.
Gender split
| Metric | Value |
|---|---|
| Female | 47.4% |
| Male | 52.6% |
| Average age | 33.0 |
| Estimated audience size | 117,242 |
Age distribution
| Age bracket | Share | % |
|---|---|---|
| 16-19 | 39% | |
| 20-29 | 21% | |
| 30-39 | 13% | |
| 40-49 | 12% | |
| 50+ | 14% |
Worldwide distribution
of the worldwide Brisbane Lions audience comes from United States.
| Country | Share |
|---|---|
| Australia | 79.8% |
| United States | 6.0% |
| United Kingdom | 2.7% |
Geography
Where the Brisbane Lions audience in United States is strongest.
Top regions by affinity
| # | Region | Reach | Affinity | × |
|---|---|---|---|---|
| 01 | Wyoming | <1K | 2.55× | |
| 02 | Hawaii | <1K | 1.79× | |
| 03 | Nevada | ~2K | 1.40× | |
| 04 | Washington, District of Columbia | <1K | 1.40× | |
| 05 | New York | ~9K | 1.32× | |
| 06 | Alaska | <1K | 1.30× | |
| 07 | Washington | ~3K | 1.12× | |
| 08 | South Dakota | <1K | 1.11× | |
| 09 | North Dakota | <1K | 1.09× | |
| 10 | Montana | <1K | 1.06× | |
| 11 | Rhode Island | <1K | 1.03× | |
| 12 | West Virginia | <1K | 1.02× | |
| 13 | Maine | <1K | 1.00× | |
| 14 | Colorado | ~2K | 0.99× | |
| 15 | Iowa | <1K | 0.99× | |
| 16 | New Hampshire | <1K | 0.98× | |
| 17 | Delaware | <1K | 0.98× | |
| 18 | Oregon | ~1K | 0.97× | |
| 19 | Idaho | <1K | 0.95× | |
| 20 | Nebraska | <1K | 0.94× | |
| 21 | Kansas | <1K | 0.93× | |
| 22 | Illinois | ~4K | 0.92× | |
| 23 | New Mexico | <1K | 0.92× | |
| 24 | Massachusetts | ~2K | 0.91× | |
| 25 | Mississippi | <1K | 0.91× | |
| 26 | Utah | <1K | 0.90× | |
| 27 | California | ~10K | 0.89× | |
| 28 | Arizona | ~2K | 0.89× | |
| 29 | Louisiana | ~1K | 0.89× | |
| 30 | Kentucky | ~1K | 0.89× | |
| 31 | Connecticut | ~1K | 0.89× | |
| 32 | Arkansas | <1K | 0.89× | |
| 33 | Missouri | ~2K | 0.87× | |
| 34 | Pennsylvania | ~3K | 0.86× | |
| 35 | Oklahoma | ~1K | 0.86× | |
| 36 | Ohio | ~3K | 0.85× | |
| 37 | New Jersey | ~3K | 0.84× | |
| 38 | Virginia | ~2K | 0.84× | |
| 39 | Indiana | ~2K | 0.84× | |
| 40 | Minnesota | ~1K | 0.83× | |
| 41 | Alabama | ~1K | 0.83× | |
| 42 | Tennessee | ~2K | 0.82× | |
| 43 | South Carolina | ~1K | 0.81× | |
| 44 | Wisconsin | ~1K | 0.81× | |
| 45 | Maryland | ~2K | 0.80× | |
| 46 | Michigan | ~2K | 0.79× | |
| 47 | Georgia | ~3K | 0.74× | |
| 48 | North Carolina | ~3K | 0.73× | |
| 49 | Texas | ~7K | 0.68× | |
| 50 | Florida | ~5K | 0.68× |
Affinity by region
Explore more audiences
Related profiles, rankings and the same audience in other markets.
More Australian football audiences in United States
- Australian Football League (1,402,600)
- AFL Grand Final (336,452)
- Geelong Football Club (175,022)
- West Coast Eagles (163,150)
- Western Bulldogs (130,224)
See Brisbane Lions audiences in other countries
- Brisbane Lions — Germany
- Brisbane Lions — United Kingdom
- Brisbane Lions — Italy
- Brisbane Lions — Spain
- Brisbane Lions — Brazil
- Brisbane Lions — France
- Brisbane Lions — Canada
- Brisbane Lions — Mexico
- Brisbane Lions — Netherlands
- Brisbane Lions — Austria
- Brisbane Lions — Belgium
- Brisbane Lions — Portugal
- Brisbane Lions — Ireland
- Brisbane Lions — Argentina
- Brisbane Lions — Sweden
- Brisbane Lions — Norway
- Brisbane Lions — Finland
- Brisbane Lions — Denmark
- Brisbane Lions — India
- Brisbane Lions — Colombia
- Brisbane Lions — Australia
- Brisbane Lions — South Africa
- Brisbane Lions — Poland
- Brisbane Lions — Malaysia
- Brisbane Lions — Switzerland
- Brisbane Lions — United Arab Emirates
- Brisbane Lions — Indonesia
- Brisbane Lions — Japan
- Brisbane Lions — South Korea
- Brisbane Lions — Saudi Arabia
How to read this data
Audience size is the estimated number of people in United States who actively search for Brisbane Lions. Affinity is an over-index ratio: 2.0× means the audience is twice as likely to engage with that brand or trait as the country average. Reach is the estimated number of audience members in a region. Regional and brand-affinity tables are sorted from strongest signal to weakest.
About this audience profile
This audience profile is generated by Rascasse from anonymized search-behavior signals across United States. For methodology see methodology. Affinity values are over-index ratios vs. the country average (1.0 = baseline). Audience sizes are estimated, not measured.
Source: Rascasse Audience Intelligence — modeled from anonymized, multi-source behavioral signals (search, social, events), updated monthly. Data status: 09/2026.
From global mass-market brands to niche local segments — explore the full library and see which intelligence layers are included.