For Sponsorship Managers at Brands
Operationalize your own target segments, find the rights holders that actually reach them, and measure real impact against your competitors.
Sponsorship decisions are still made on gross reach, media kits and personal preference. The question that matters — does this property reach our target segments, and what is it worth to us? — goes unanswered until the deal is already signed.
That is why Rascasse evaluates sponsorships on real audience behavior — measured against your own strategic segments, not against an average customer.
Stop buying reach. Start buying fit.
Every brand has strategic target segments — but they live in strategy decks, not in data. Rascasse operationalizes your segmentation: each segment becomes a real, measurable audience with size, demographics, interests and regional distribution, built from behavioral signals instead of survey quotas.
From then on, every sponsorship question is answered per segment — not for an average customer who doesn’t exist.
⚠ Illustrative example — fictitious data for demonstration only
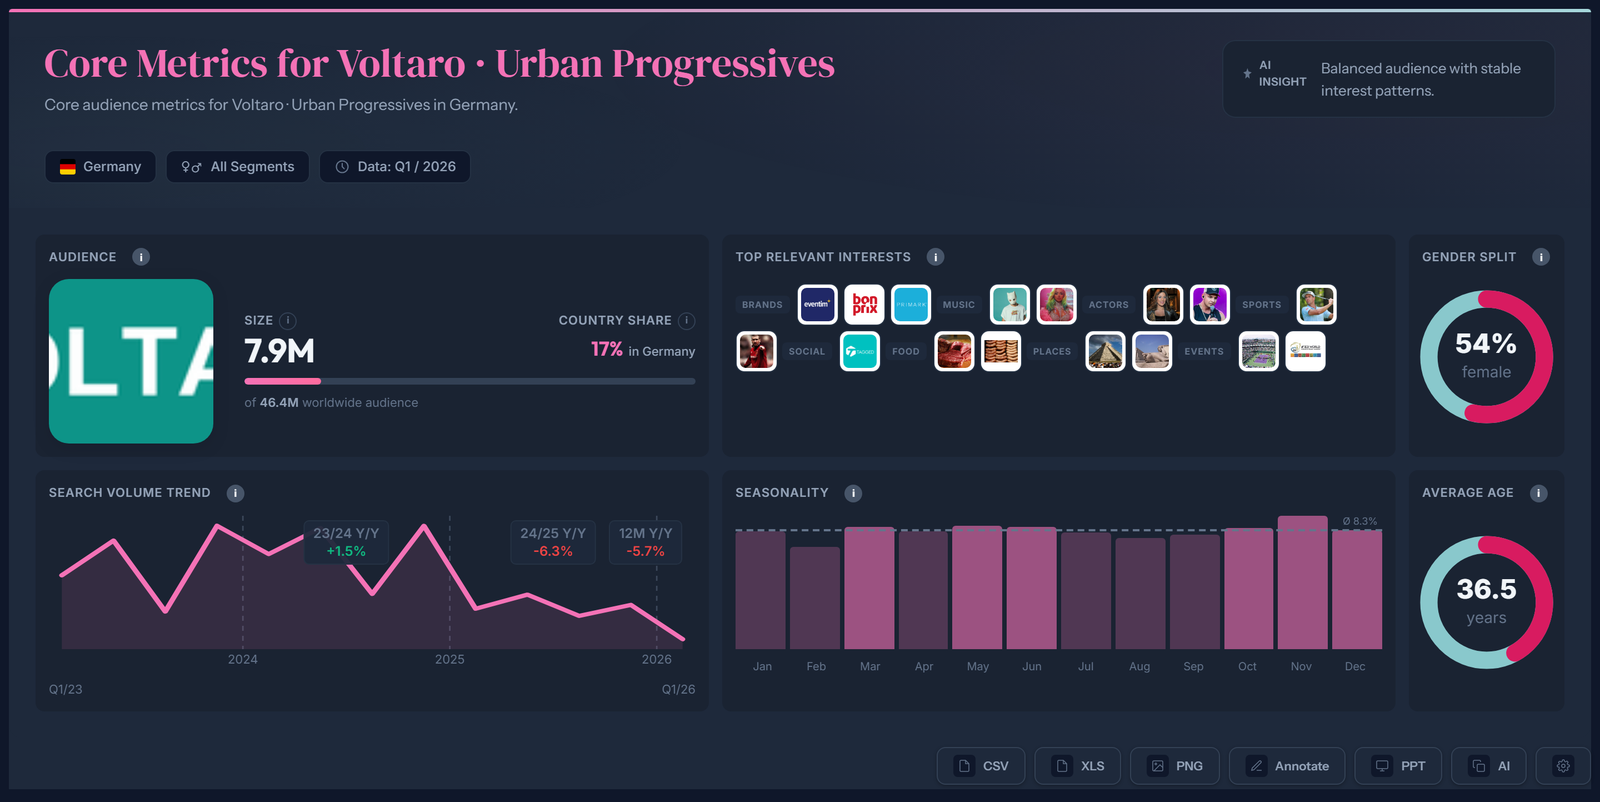
What you see: the strategy segment “Urban Progressives” of our demo brand Voltaro as a real audience — 7.9M people in Germany, with search trend, seasonality, gender split, average age and top interests. Two more segments — Established Families and Weekend Adventurers — were operationalized the same way.
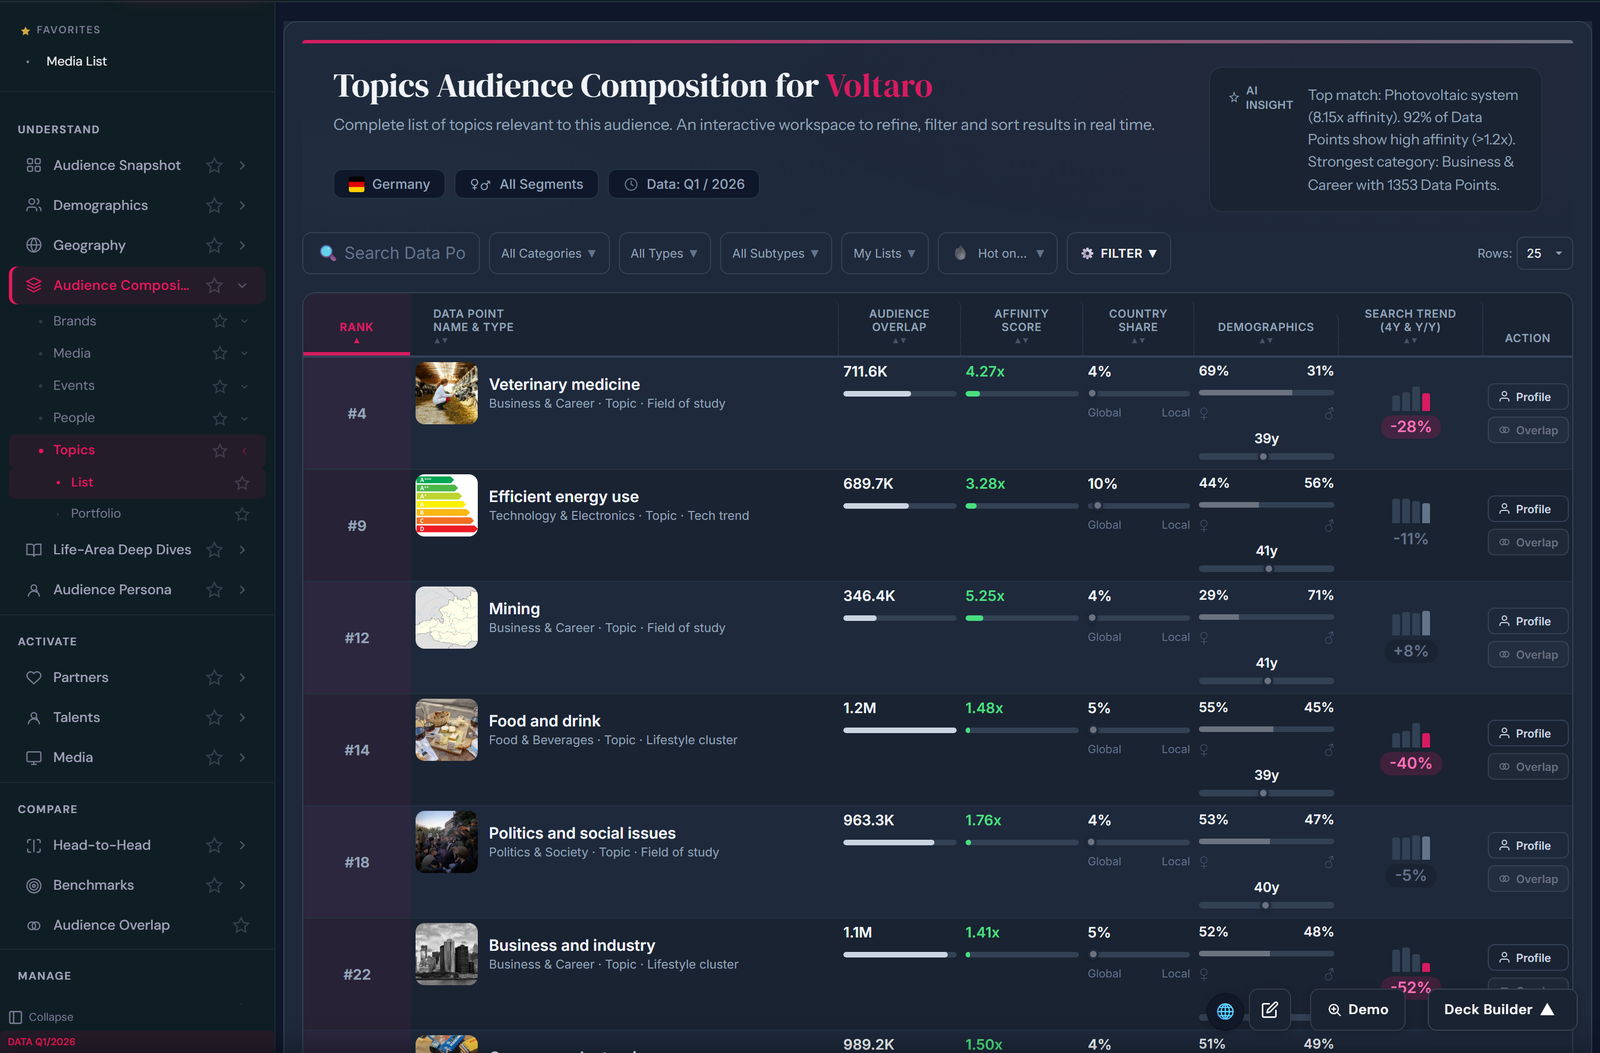
Interests, demographics and geography of the people who engage with your brand — from 500,000+ data points across 200+ countries. The baseline every sponsorship decision is measured against.
⚠ Illustrative example — fictitious data for demonstration only
What you see: the ranked interest profile of the Voltaro audience — each data point with overlap, affinity score, demographics and search trend.
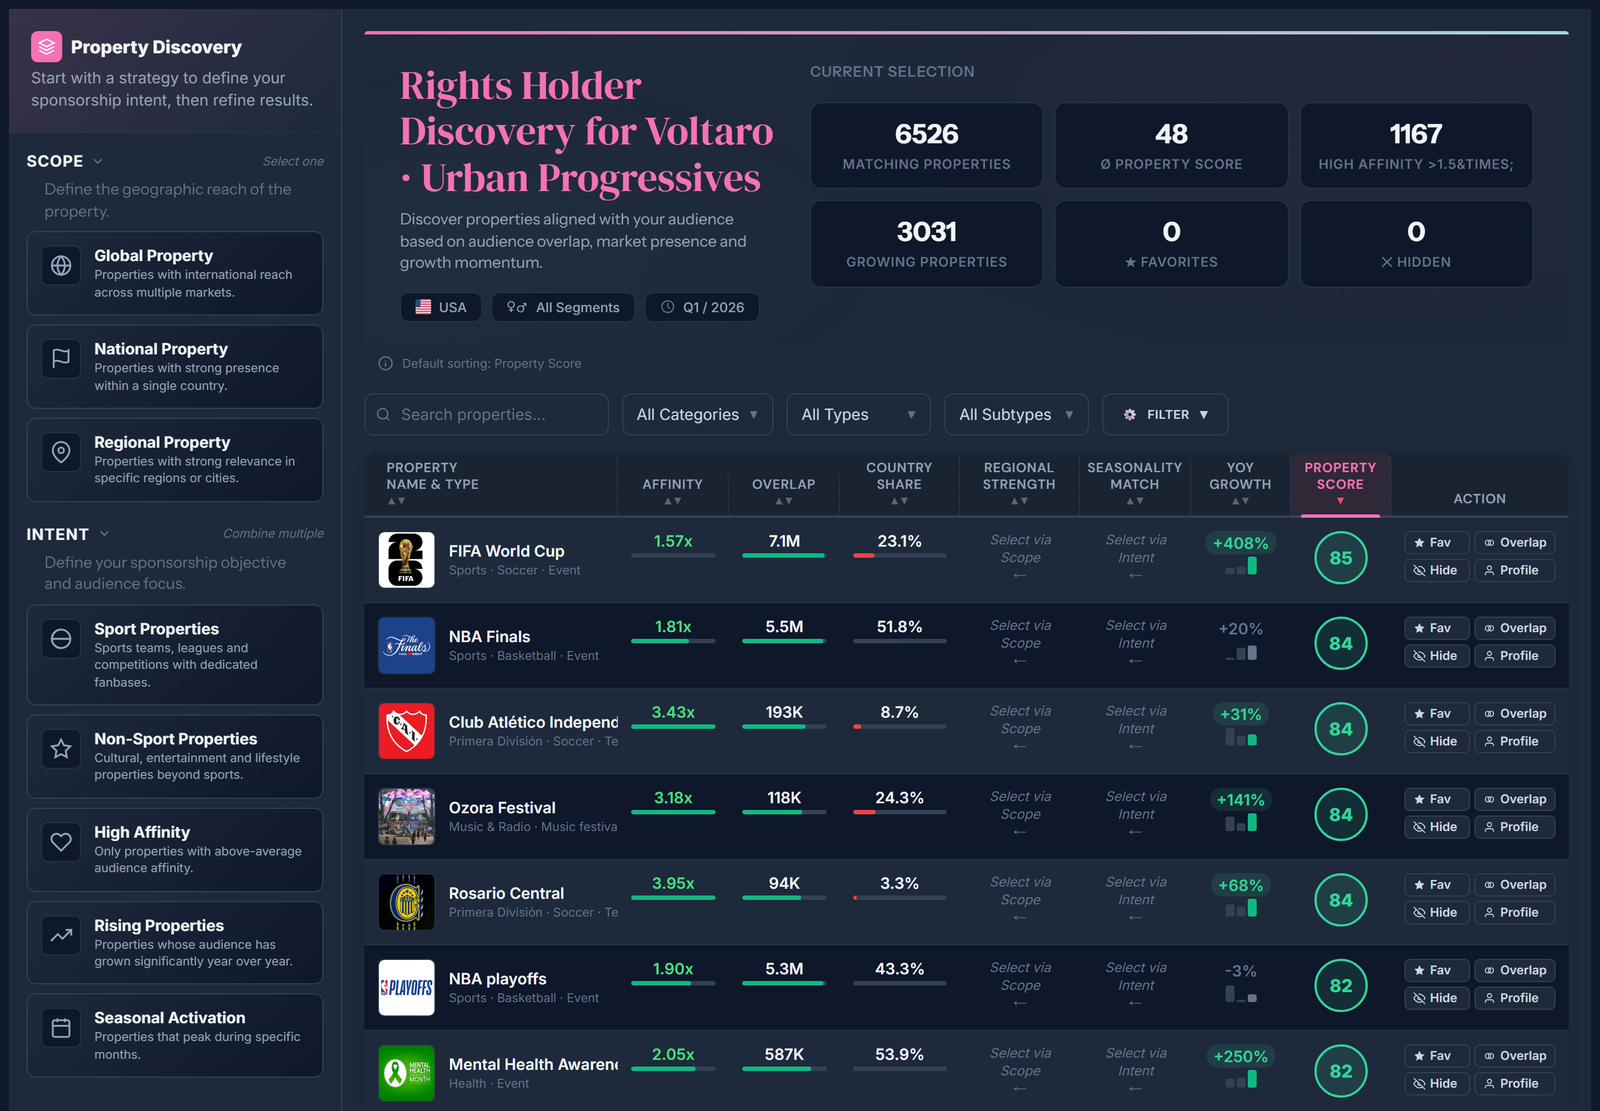
Scope and intent presets — global, national, regional; endemic or surprising — narrow the field in one click.
⚠ Illustrative example — fictitious data for demonstration only
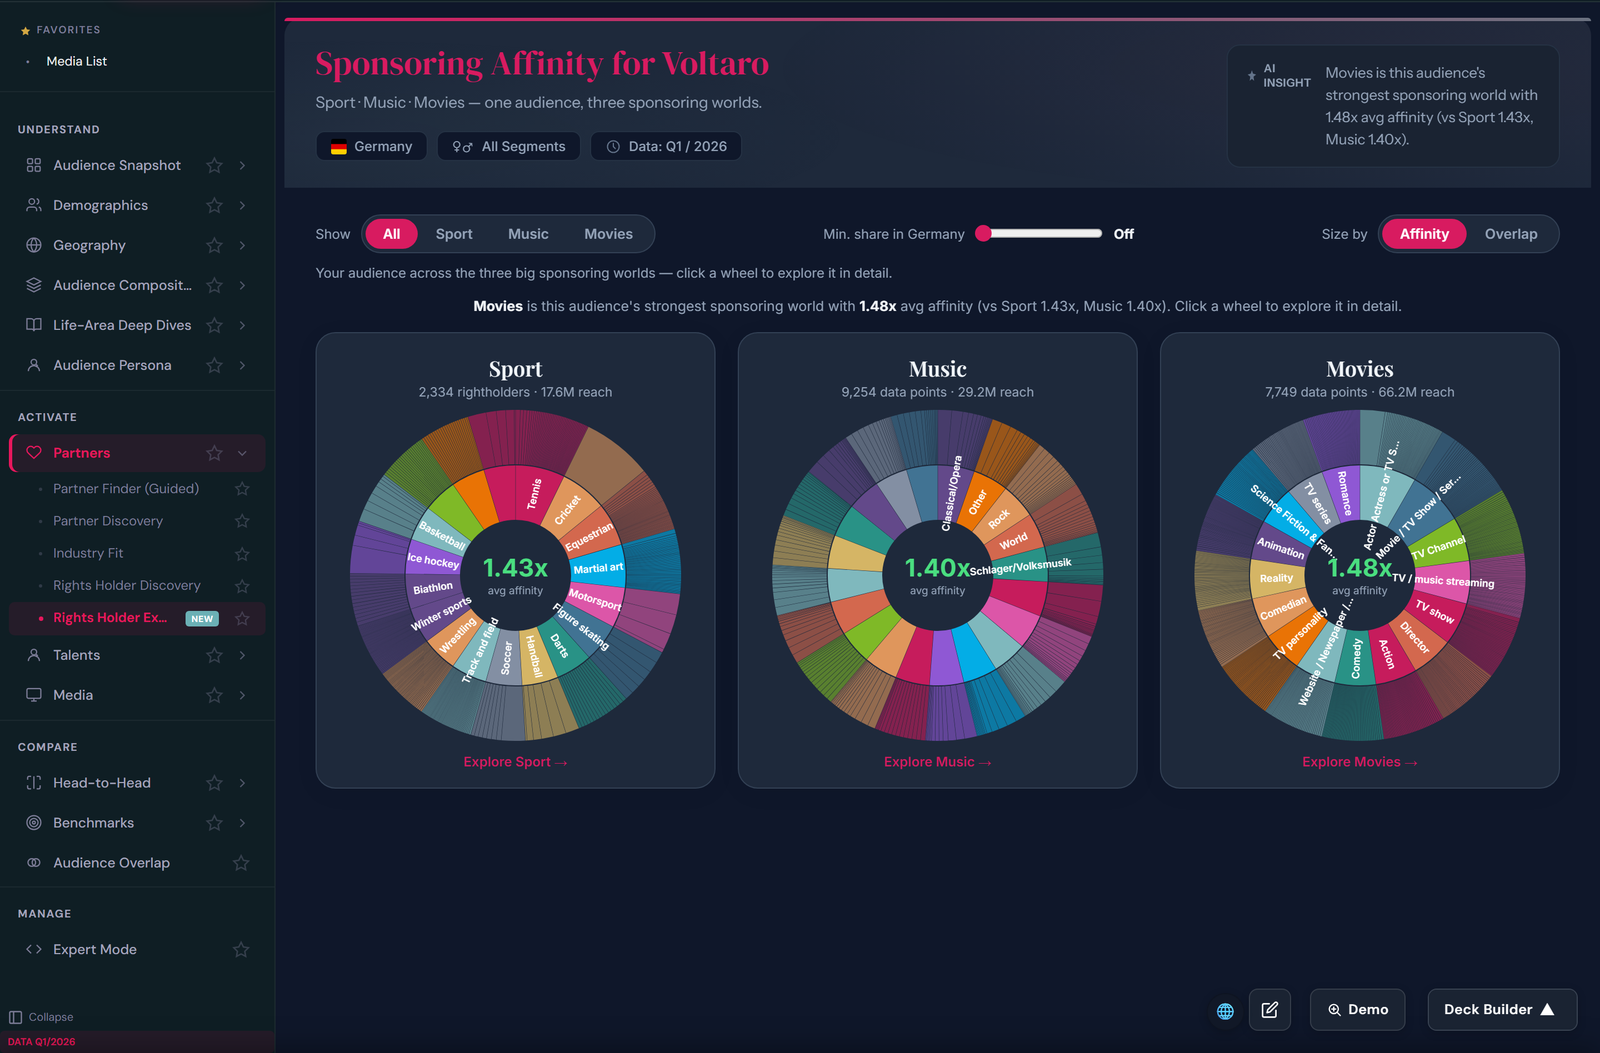
The Rights Holder Explorer maps your audience’s affinity across sport, music and movies. Click into any wheel to drill from world to discipline to individual property.
⚠ Illustrative example — fictitious data for demonstration only
What you see: Voltaro’s sponsoring affinity across the three worlds — average affinity per world, reach per world, and every discipline and genre as a drillable segment.
30 minutes, your brand and your segments as the live example.
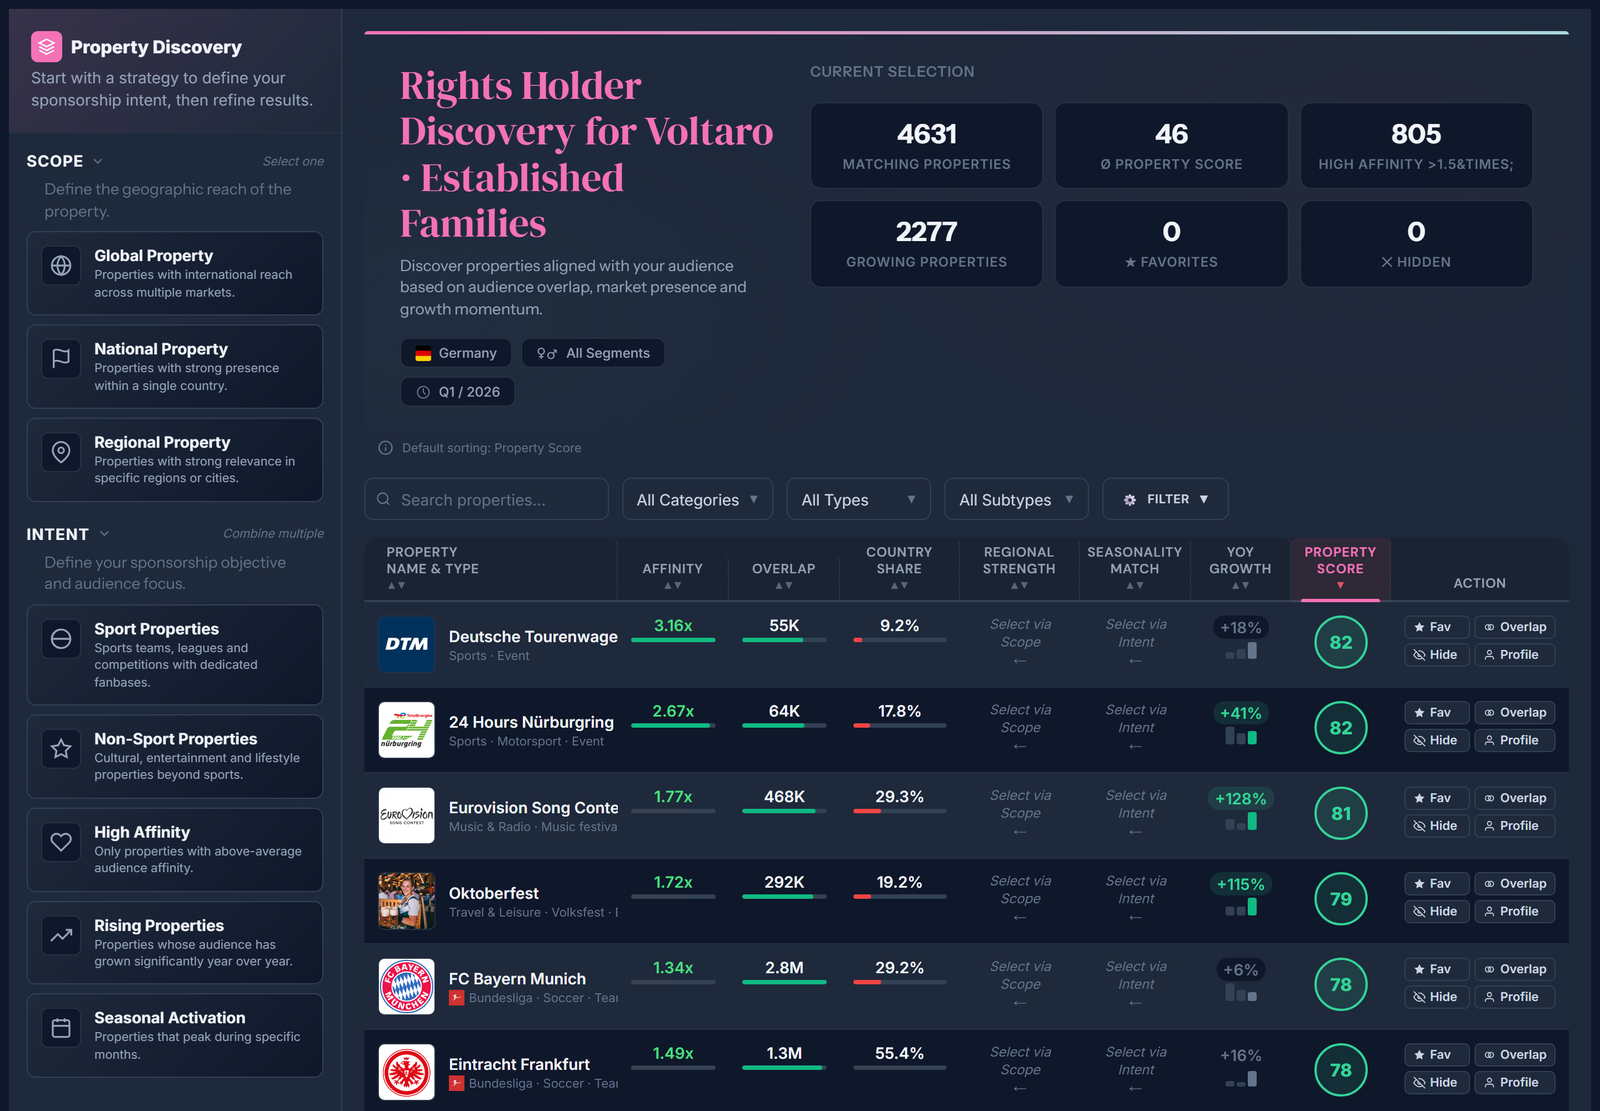
Run the discovery once per segment and the shortlists diverge: Urban Progressives over-index on festivals and basketball, Established Families on family entertainment and regional clubs. That difference is exactly what buying fit — instead of gross reach — looks like.
⚠ Illustrative example — fictitious data for demonstration only
What you see: the same discovery, run for the Established Families segment in Germany — a visibly different top list than for Urban Progressives.
“One property never fits all segments. Now you can see which one it fits — before the negotiation.”
Per-segment shortlists turn sponsorship from a brand bet into a portfolio decision.
Do fans search for your brand? Follow it on TikTok and Instagram? Rascasse measures monthly, before / during / after the deal, down to the individual matchday — always benchmarked against your competitors, so seasonality and category trends are stripped out.
The same data tells you when to refresh the activation mid-season — and gives your CFO the renewal argument in one sentence.
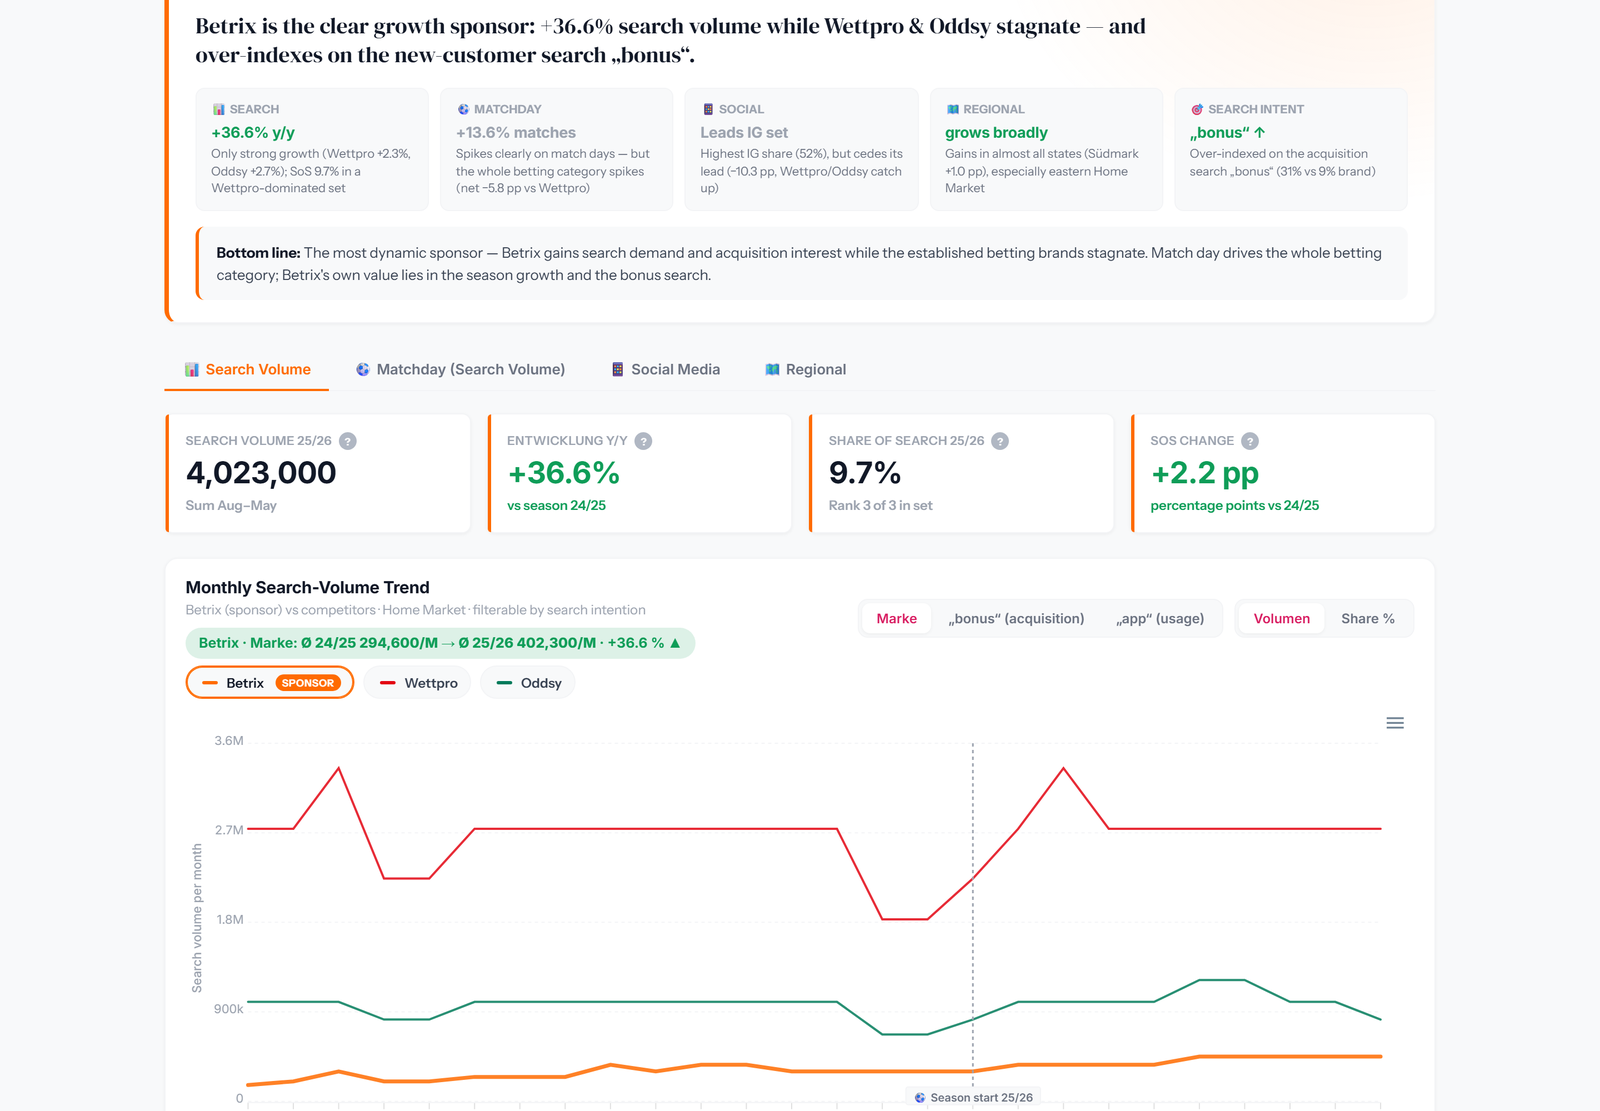
⚠ Illustrative example — fictitious data for demonstration only
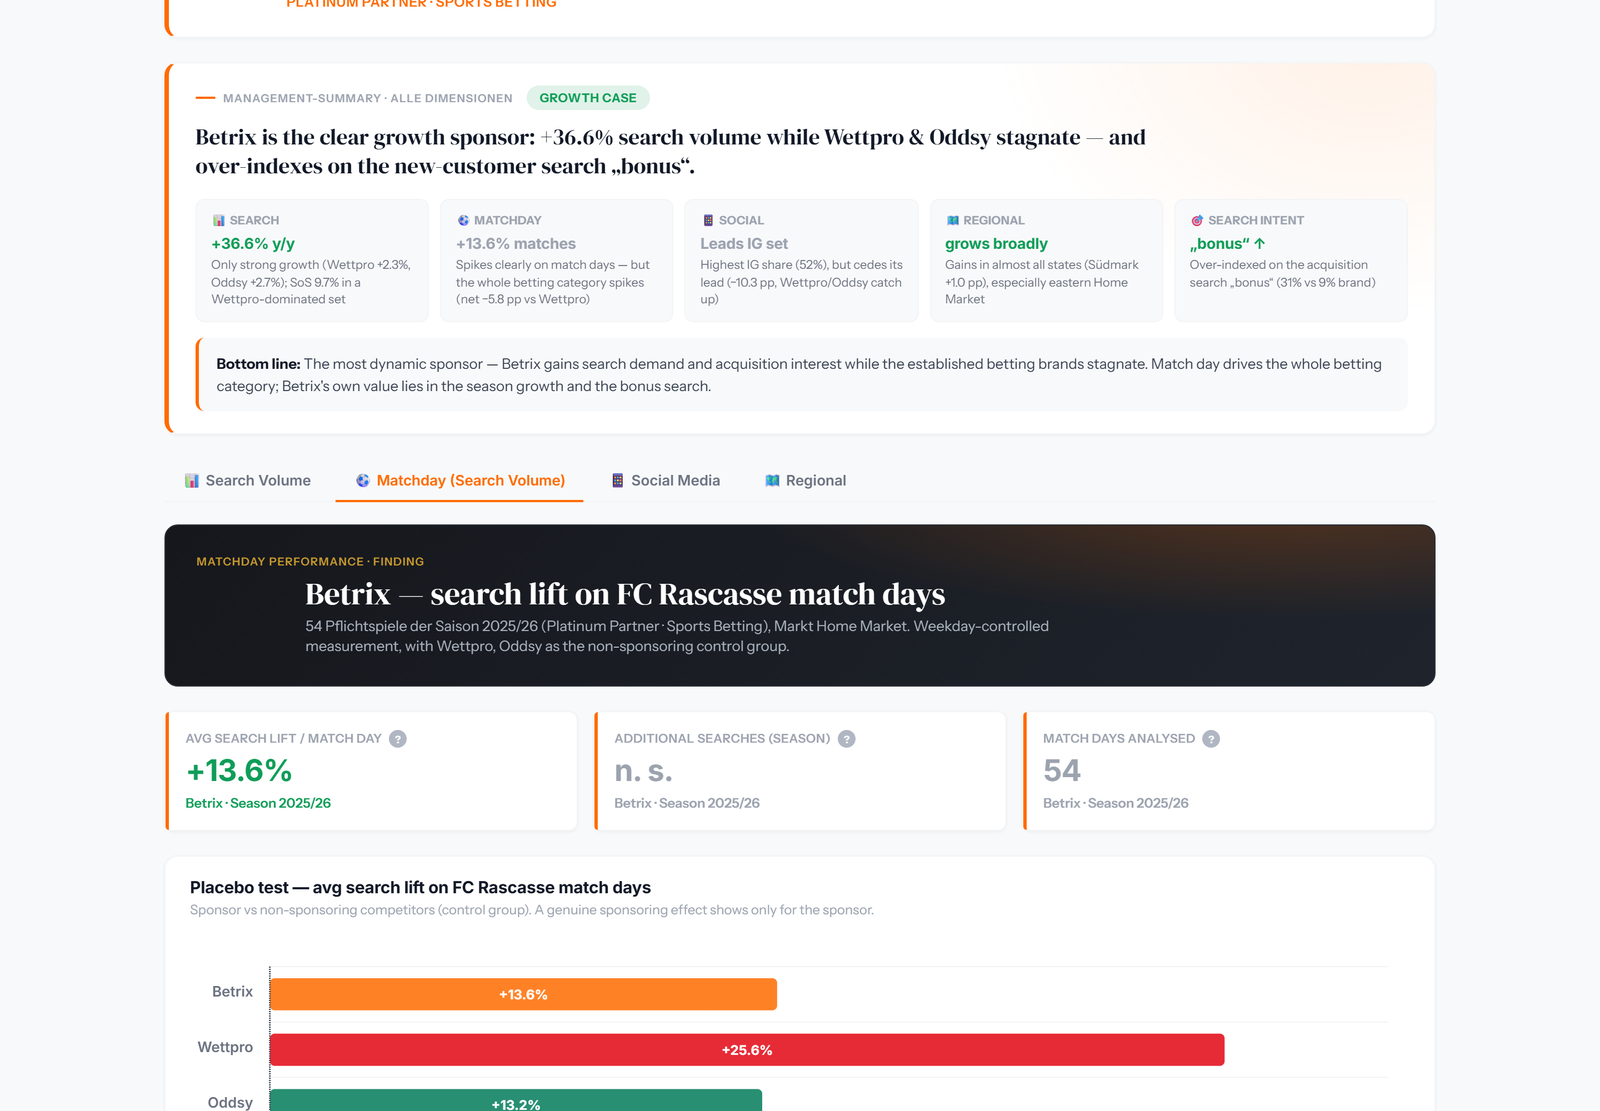
What you see: the sponsor detail from the live impact report — +36.6% search volume year over year and the monthly trend versus the two biggest competitors, with a season-start marker.
⚠ Illustrative example — fictitious data for demonstration only
What you see: weekday-controlled search lift across all 54 matches of the season — including a placebo test against non-sponsoring competitors as the control group. A lift only counts as a sponsoring effect if the control group doesn’t spike too.
“Search interest in our brand grew measurably among the fans — while our competitors stayed flat.”
That is the sentence that wins the internal budget discussion — and it comes straight out of the report.
Rascasse plugs straight into your AI stack via MCP: ask Claude or your own copilot for audience overlaps, segment fits or property scores — and get live data back, no dashboard required.
Every chart exports to PowerPoint in your corporate design — complete decks generated in one batch run, not hundreds of manual downloads.
Raw exports behind every chart for your BI stack and your own slides — the same numbers everywhere.
Exposure trackers, panels, listening platforms and follower stats each measure something — just not whether a property’s audience contains your customers.
measures visibility. We measure effect.
Exposure tools count the seconds a logo was on screen. We show whether anyone actually cared — searched, followed, engaged.
ask a sample. We measure behavior at scale.
Modeled full coverage from real behavioral signals instead of what a few thousand respondents say they do.
shows conversations. Not your audience.
Knowing what is being talked about is not the same as knowing who your fans are, what they buy, and which brands they love.
show who follows you. Not who your audience is.
Your commercial audience is bigger than your follower base — and only the audience itself can be matched against 50,000+ sponsor brands.