
Home / Audience Intelligence / Segmentation & Personas
Segmentation & Personas · for brands, agencies and insights teams
Any segment you can describe. Including the ones you already have.
Build segments from 500,000+ data points, or bring your existing segmentation and keep working with it. Each segment gets a full profile, a persona, its own media mix, its own locations and its own talents, ready within 24 hours and comparable across 200+ countries.
- Your own segments integrated
- Up to 250K data points each
- 24h to a new segment
Used by brands, agencies, media and rights holders











What slows you down
Segments that nobody can use
The segmentation was expensive, but it sits in a PDF. Nobody can use it in daily planning.
Every provider brings its own clusters, so your own segments get lost along the way.
Personas are written once, from interviews. They are never checked against behaviour.
Comparing a segment across countries means a new study every time.
How it works
Build new segments, or keep yours
Segments are built from behavioural signals, so any definition works, from a mass market to a sharp niche.
Several audiences on one cultural map
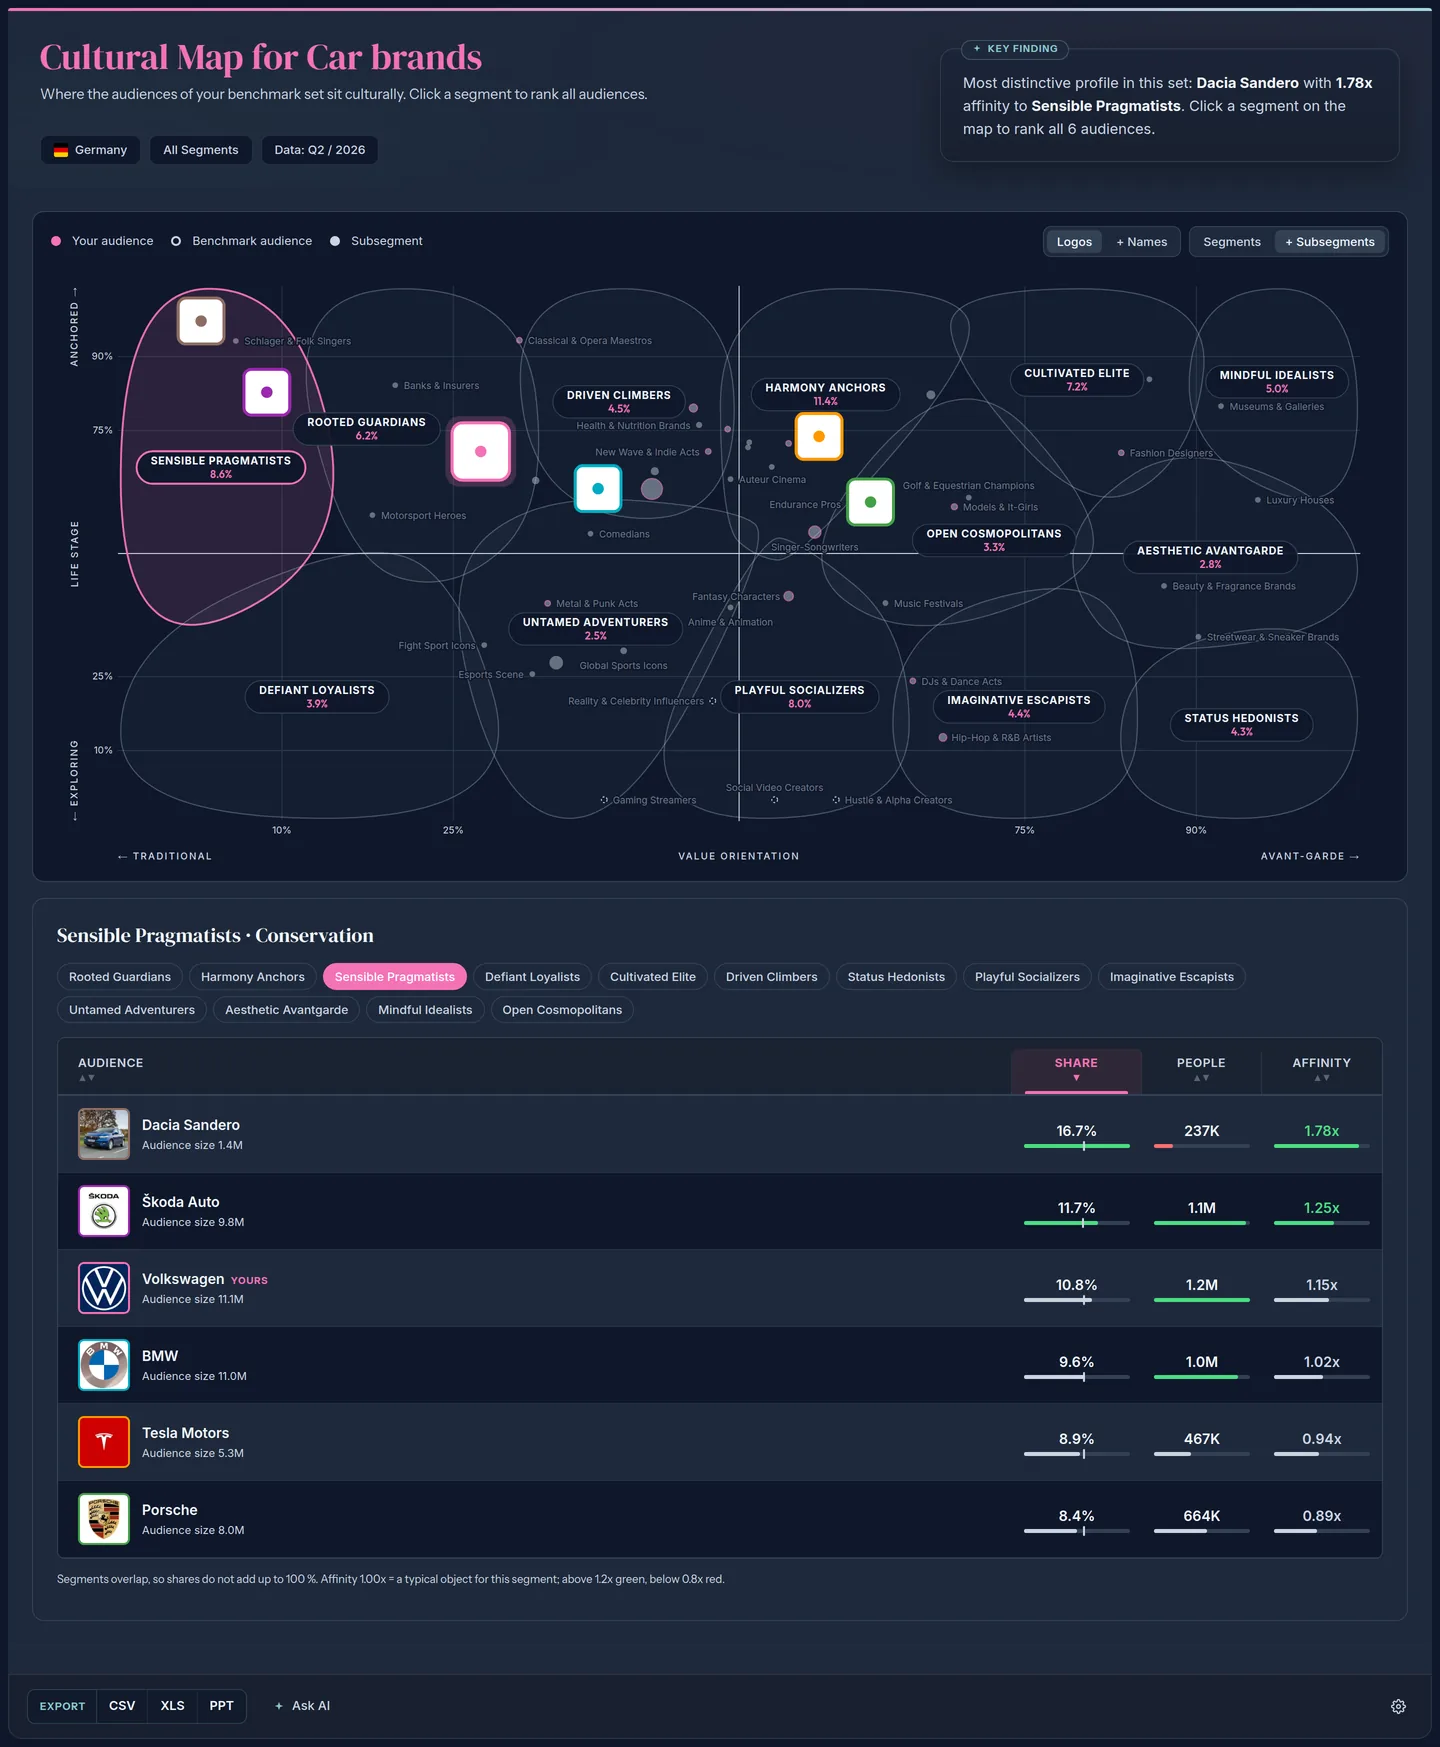
The Cultural Map places any set of audiences on twelve cultural segments, value orientation against life stage. Click a segment and every audience is ranked by share, people and affinity.
Sensible Pragmatists in Germany: Dacia leads with 1.78× affinity, Volkswagen sits in the middle (1.15×), Porsche is below average (0.89×).
Your audience, split into the groups inside it
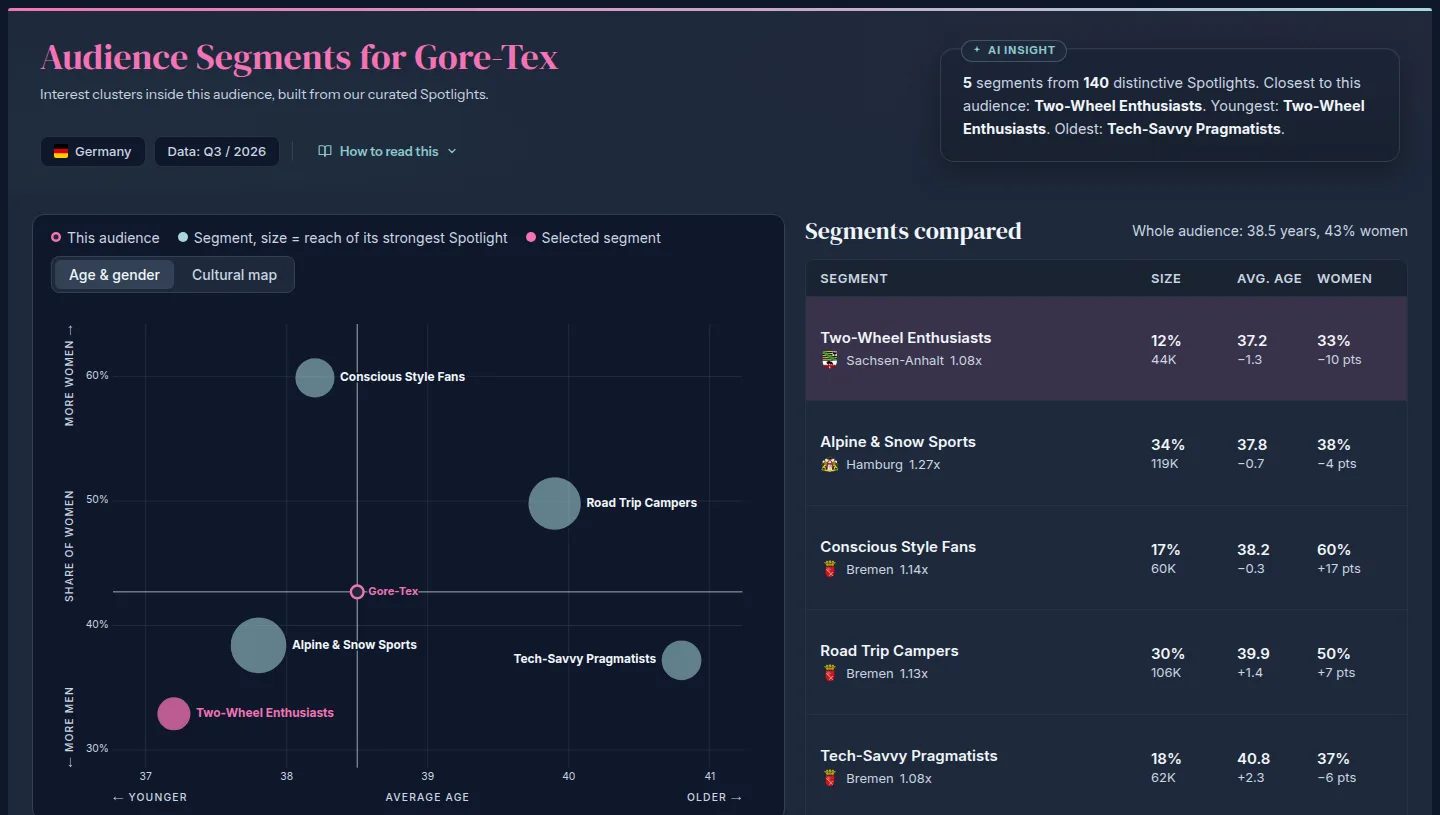
Audience Segments splits an audience into five to eight segments, each held together by shared interests, with its own size, age, share of women and the places where it is strongest. Gore-Tex in Germany: five segments, from Two-Wheel Enthusiasts (12 %, younger and more male) to Conscious Style Fans (17 %, 60 % women).
- Five to eight segments per audience, built from Spotlights
- Size, average age and share of women per segment
- Regions and cities where each segment is strongest
- Germany, the US, the UK, France, Italy, Spain, Brazil and Australia
A Perfect Day for every segment
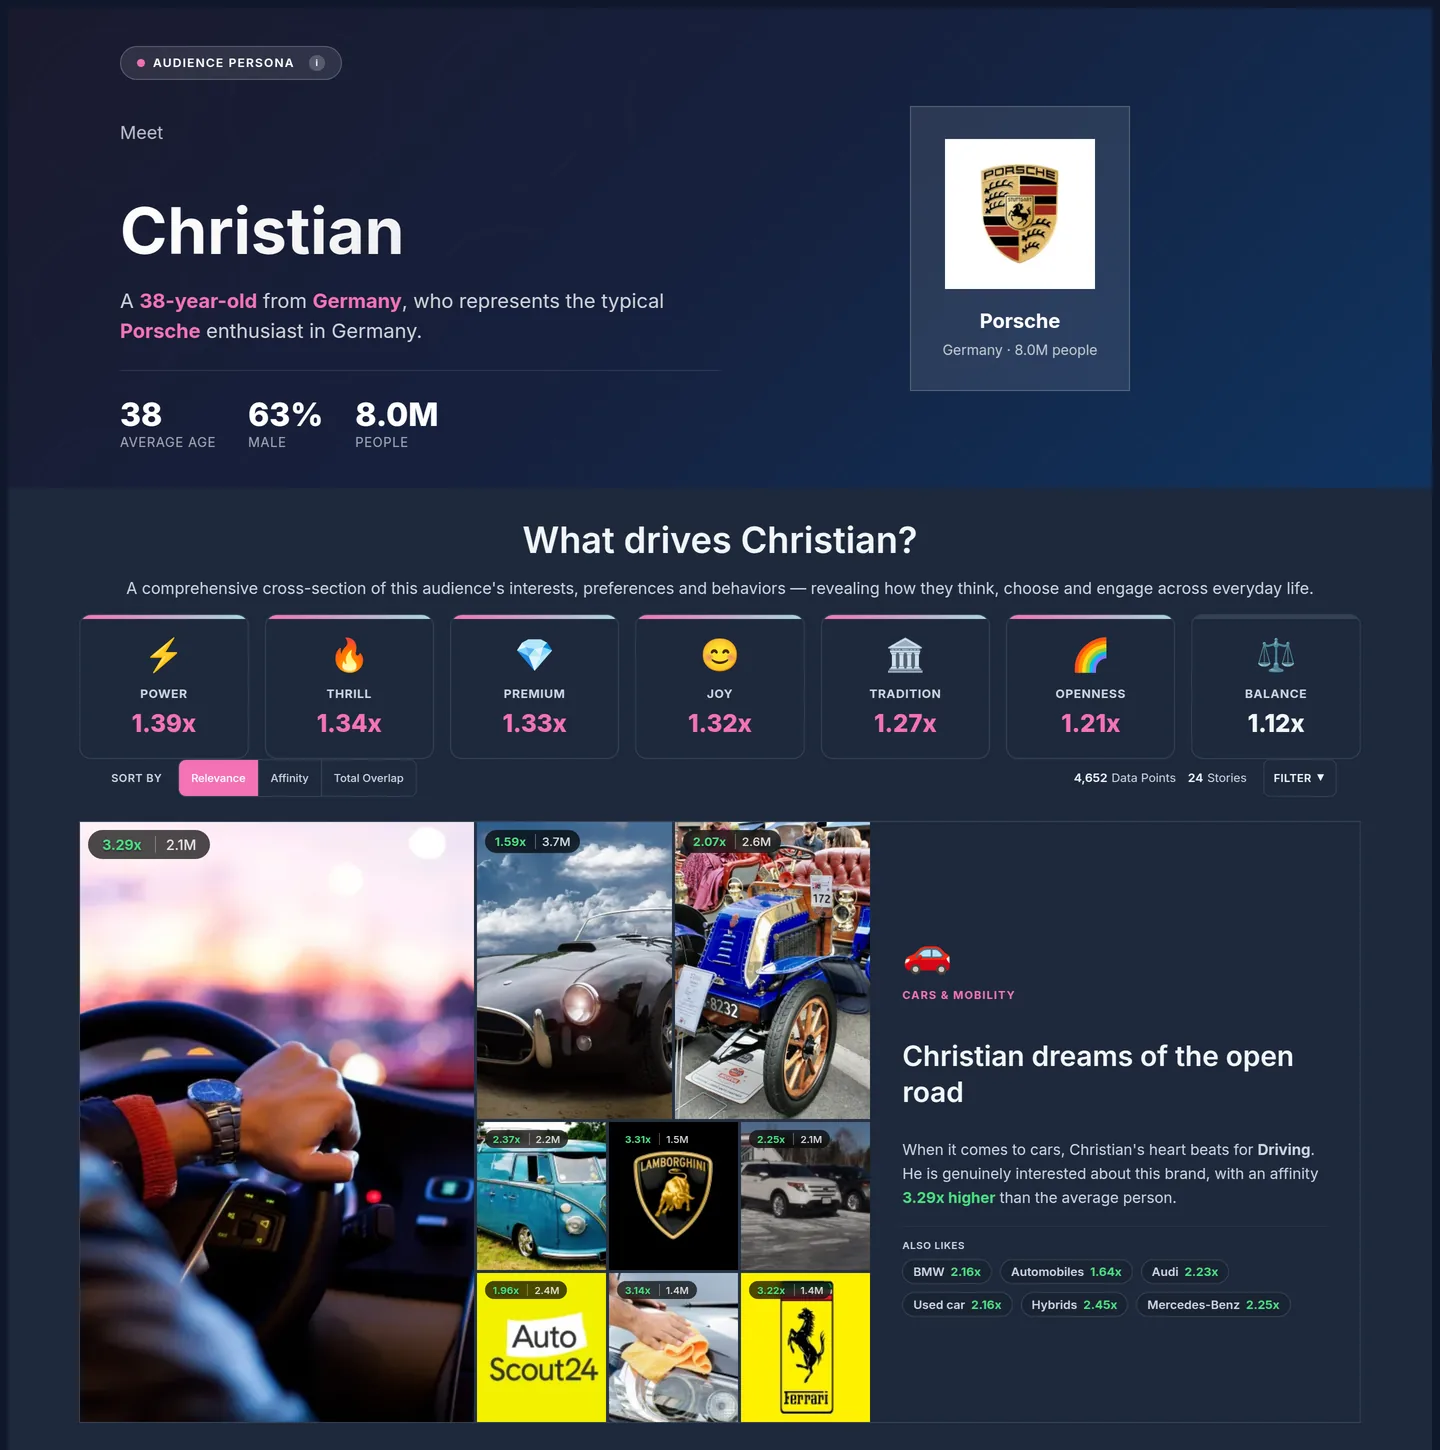
The Perfect Day turns a segment into a person: the typical member, what drives them and what they love, from cars and sport to media and food. Built from data, not from interviews, and updated every quarter.
- Meet Christian: 38, from Germany, the typical Porsche enthusiast
- Power, thrill and premium are his strongest drivers
- Each story backed by the brands and topics behind it
One audience, two different profiles
Head-to-Head also works inside an audience. Set women against men and the psychographics sit side by side, on the same scale. In the Porsche audience in Germany, both are drawn to luxury. On most other values they are far apart, so a message written for the average reaches neither group well.
- Luxury orientation connects both: 1.47× for women, 1.61× for men
- Women over-index on healthy lifestyle and creativity
- Men over-index on early adoption, risk appetite and quality
WomenMen
Market average = 1.0×
Each segment has its own map
Segments are not spread evenly across a country. See where each one is strong, by region and city, and by postal code where available. In Germany, the Porsche audience over-indexes in Hamburg, Berlin and Baden-Württemberg. The Dacia audience is below average in all three and stronger in Saarland, Saxony and Thuringia.
- Affinity and audience size for each place
- Segments compared on the same map
- A base for out-of-home and local targeting
DaciaPorsche
National average = 1.0×
A media plan for each segment
Media planning starts from the segment, not from a channel list. Affinity shows where a segment over-indexes, audience size shows how many people you can reach there. In Germany, the Porsche audience leans towards Snapchat, SoundCloud and Spotify, the Dacia audience towards Amazon Music, Apple TV and Discord.
- Social platforms, streaming, TV, radio and podcasts
- Interests for Meta and TikTok targeting
- More on media planning
DaciaPorsche
Market average = 1.0×
Rascasse inside Claude, ChatGPT, Copilot and Gemini
Connect Rascasse to your AI assistant through MCP and work with your segments in conversation.
- Works with Claude, ChatGPT, Microsoft Copilot, Gemini and other MCP clients
- Your own segments available by name
- Available as part of your agreement, API included
Harmony Anchors is the largest segment on the map (11.4 %):
| Brand | Share | Affinity |
|---|---|---|
| Škoda | 12.4 % | 1.20× |
| Dacia | 10.9 % | 1.05× |
| Volkswagen | 10.9 % | 1.05× |
| BMW | 9.6 % | 0.92× |
| Tesla | 9.4 % | 0.91× |
| Porsche | 9.4 % | 0.91× |
Volkswagen is level with Dacia and just behind Škoda. BMW, Tesla and Porsche are slightly below average in this segment.
Start small
Start with a Proof Case
Two or three of your segments rebuilt, profiled and compared, each with a persona and a media mix. A fixed scope and a fixed price, presented to the people who decide, and credited against the Annual fee if you continue.
Your segmentation is only worth what your teams can do with it. Bring it to life before the next planning round.
Questions
Before you ask
Can you rebuild our existing segmentation?
Yes. We map your segments to behavioural building blocks and set them up in the Rascasse Solution, so your teams keep the names and logic they already use, now with live data.
How many segments can we have?
As many as you need. Each segment is a full audience with up to 250,000 data points.
How fast is a new segment ready?
Usually within 24 hours.
Can we compare women and men within a segment?
Yes. Head-to-Head shows the psychographics of two groups inside one audience side by side, on the same scale.
Can we see where a segment is located?
Yes, by region and city, and by postal code where available, with the affinity and the size for each place.
Does each segment get its own media plan?
Each segment shows the social platforms, streaming services, TV, radio and podcasts where it over-indexes, with the audience size behind them.
What is the Cultural Map?
A map of twelve cultural segments, from value orientation to life stage, built from behaviour. It shows where any set of audiences sits and ranks them by share, people and affinity.
What is a Perfect Day?
A persona built from data: the typical member of an audience, with the interests, brands and habits that drive them, written out as a story.
Where does the data come from?
From AI-based analysis of aggregated digital behaviour signals, not surveys: aggregated and anonymous, no panels, no questionnaires.
How do we start?
With a Proof Case: two or three of your segments rebuilt, profiled and compared, at a fixed scope and price.
More in Audience Intelligence