
Home / Brand & Market Share / Competitive Intelligence
Competitive Intelligence · for brands, agencies and investors
See the whole industry. City by city.
Not just your brand: Rascasse compares every brand in your industry by share of search, region and city, so you see where trends start and which brand sets them.
- Whole industry
- Cities and regions
- 10 years back
Used by brands, agencies, media and rights holders








How we read the signals
Every brand, every city. Who leads, who follows.
We measure every brand of a category the same way, down to cities, and over time. So you see where a trend starts and who wins it.
- Share: each brand’s share of demand
- Cities: where each brand over-performs
- Momentum: who gains where, quarter by quarter
What slows you down
Competitor views from annual reports
Reports arrive when the market has moved.
Trends start in cities, not countries.
The challengers stay invisible.
Numbers without the events behind them.
Where you win, and where they do
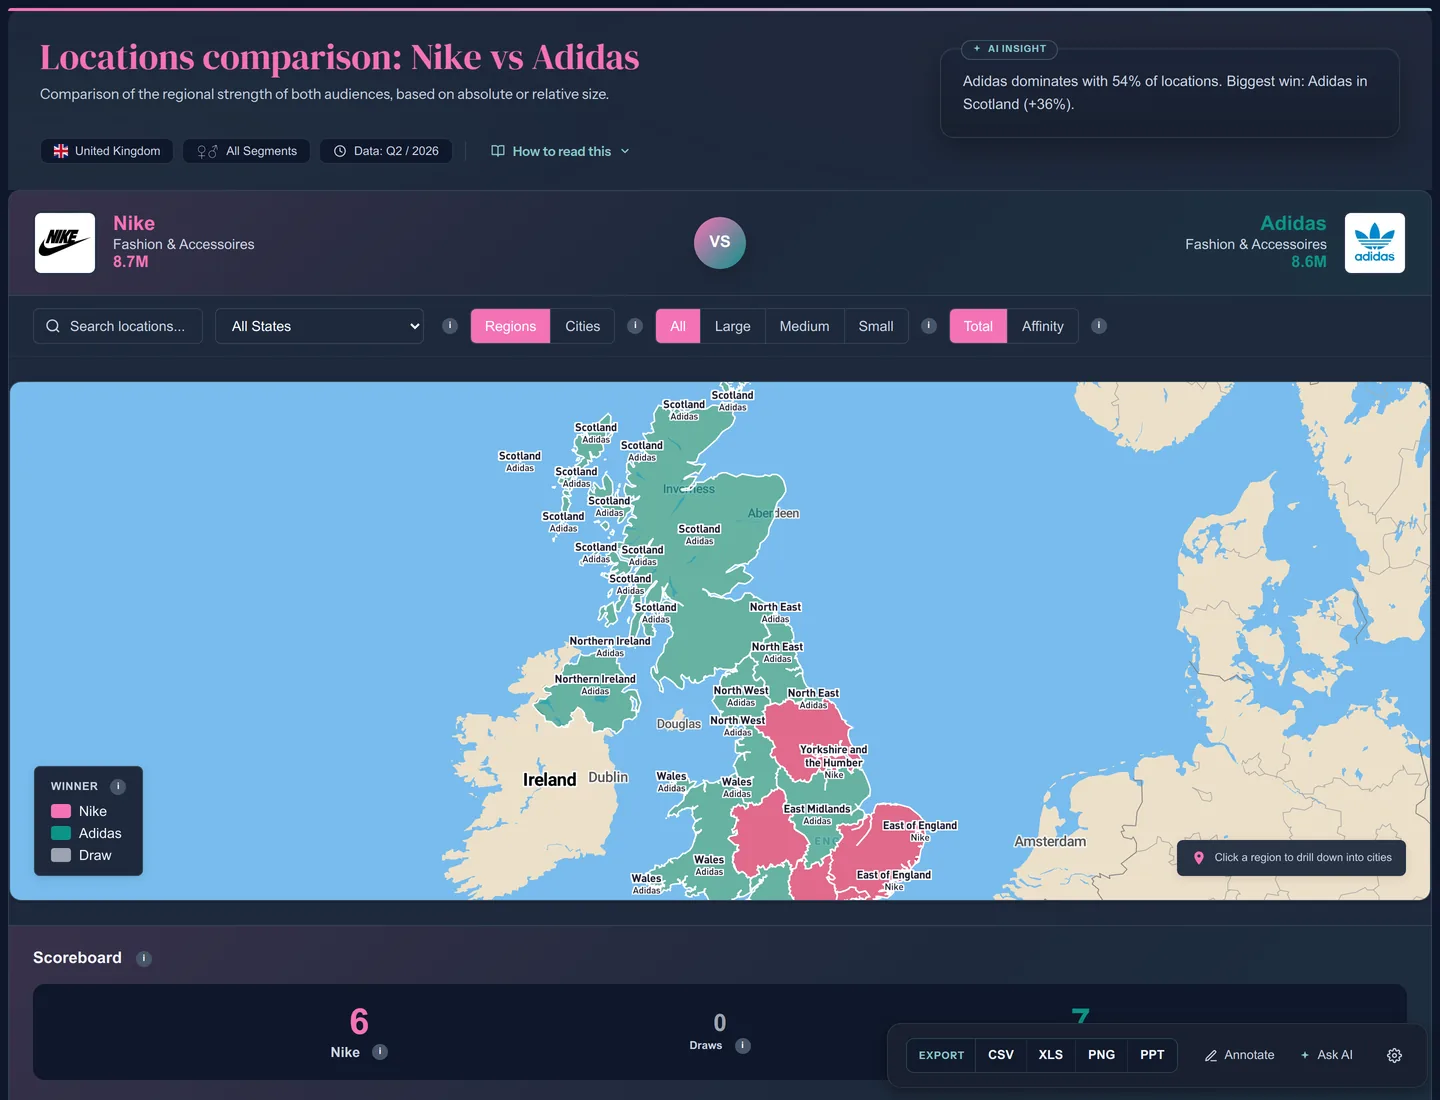
Nike against Adidas in the UK, region by region: Adidas leads in more regions, Scotland is its strongest win.
The whole category on one chart
Share of search for the brands in a category. Nike in the UK: 31.4 % over the last twelve months, first of six sportswear brands, but down 3.5 points.
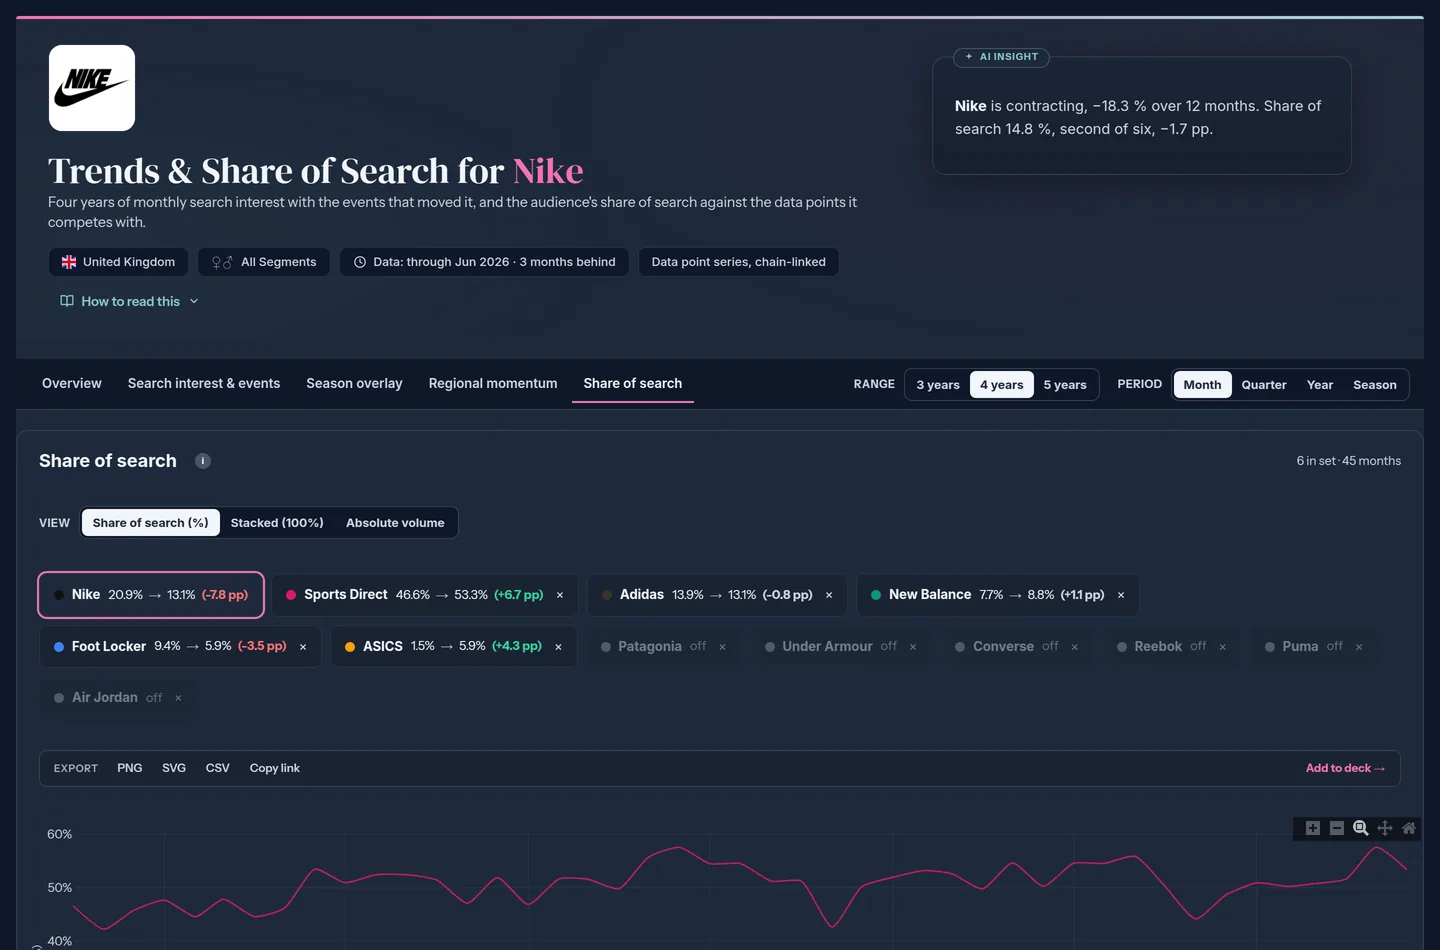
Sportswear brands in the UK: Nike leads a set of six.
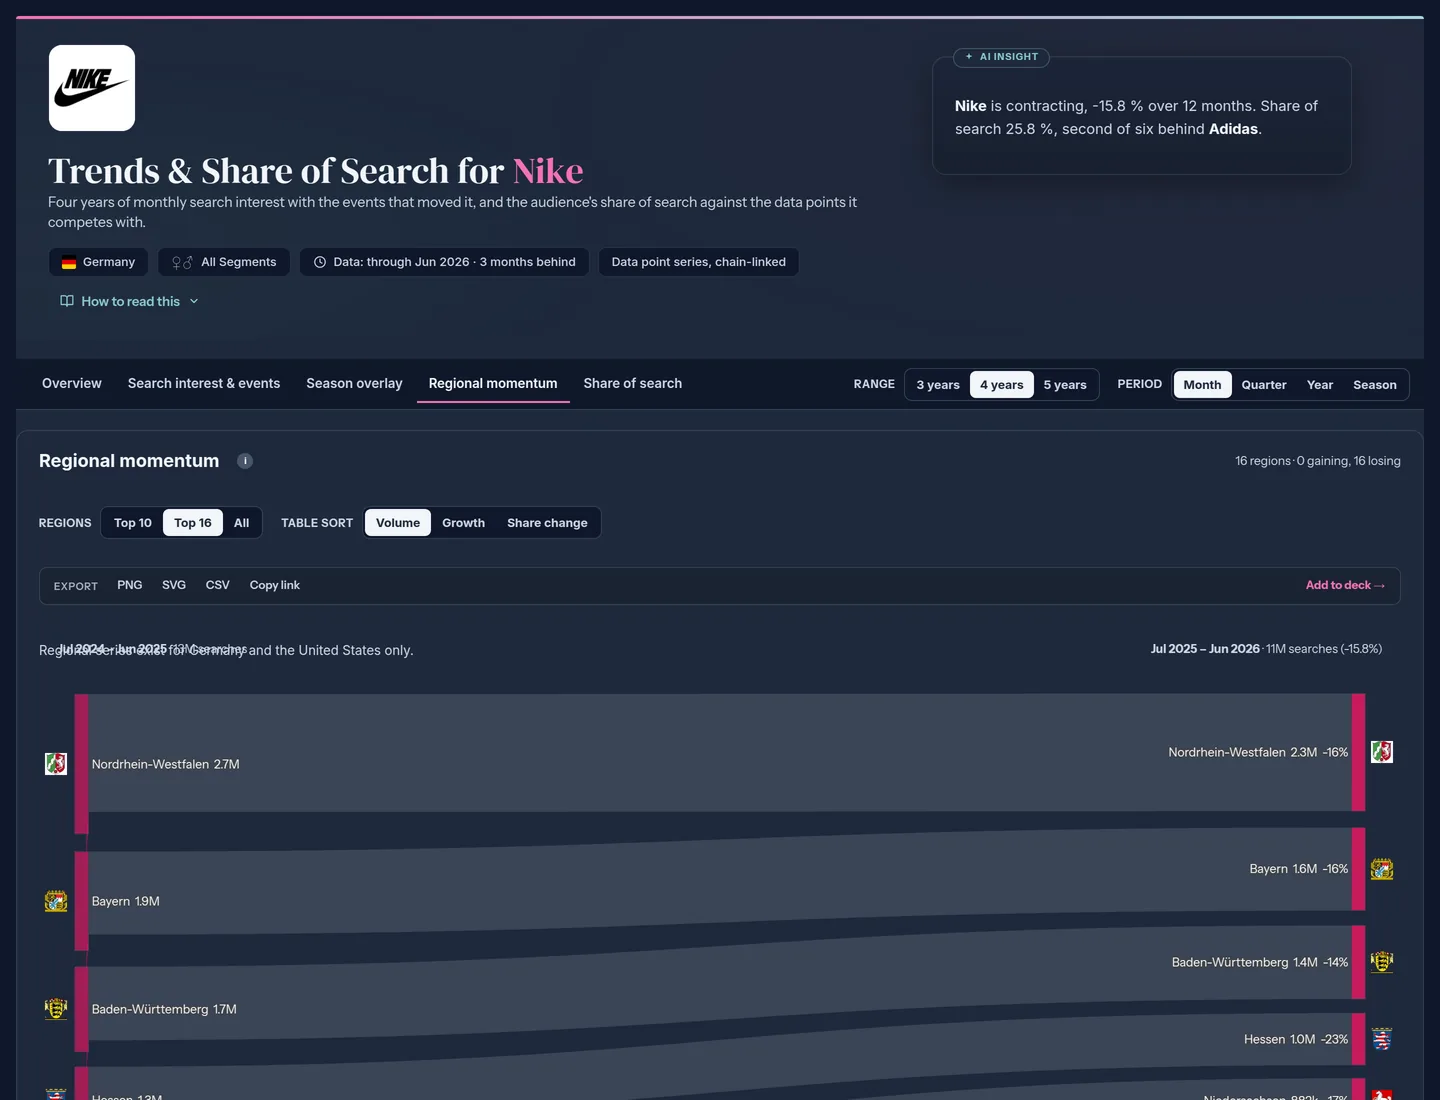
Where a brand gained or lost, region by region.
The cities that move first
Trends rarely start nationally. City-level data shows where a brand or topic takes off first, and which brand leads it there.
Rascasse inside Claude and ChatGPT
Connect Rascasse to your AI assistant through MCP and watch competitors in conversation.
- Works with Claude, ChatGPT and other MCP clients
- Any category, any market, any city
- Available as part of your agreement, API included
Share of search, last twelve months:
| Brand | Position |
|---|---|
| Nike | 1st, 31.4 % |
| Change | −3.5 pp |
| Set | six sportswear brands |
Nike leads but is contracting (−18.3 %); watch where Adidas gains, starting in Scotland.
What you get
A live view of your industry
Start small
Start with a Proof Case
Your category in one market: every brand, share by city and region, ten years back. A fixed scope and a fixed price, presented to the people who decide, and credited against the Annual fee if you continue.
By the time a trend is national, the trend setter has won. Watch the cities.
Questions
Before you ask
How many competitors?
As many as you need, including small challengers; missing brands are added within two hours.
Where does the data come from?
From AI-based analysis of aggregated digital behaviour signals, not surveys: what people search, follow, watch and listen to, aggregated and anonymous. No panels and no questionnaires.
Is this personal data?
No. We work with aggregated signals only: no names, no e-mail addresses, no individual profiles.
More in Brand & Market Share