Boston Bruins Fan Demographics in United States
Boston Bruins has an estimated audience of 7.1M people in United States.
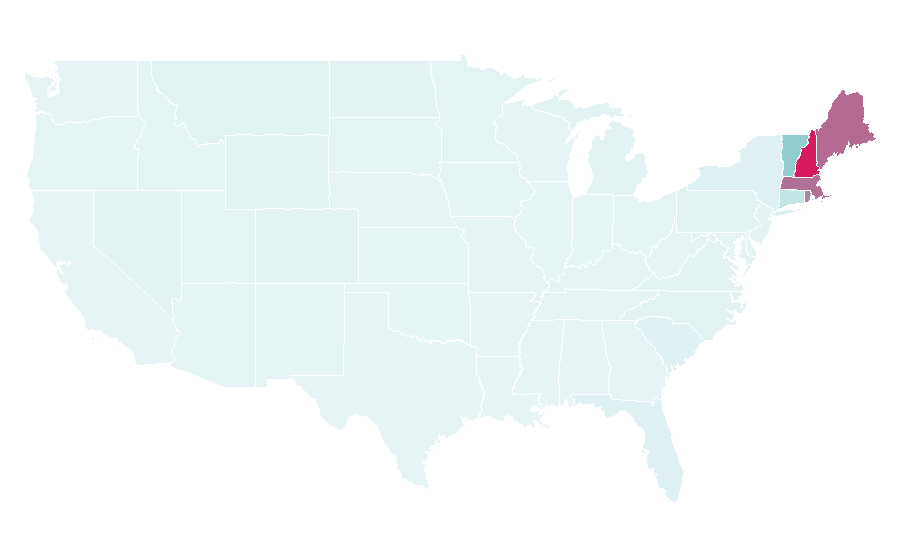
The average Boston Bruins fan in United States is 40.6 years old, more male, and lives primarily in Massachusetts.
By number of fans, Boston Bruins ranks #4 among the 33 NHL teams in United States — 2.0× the group median.
Its fans are 2.3 years older than the group average of 38.3.
Women make up 32.1% of the fan base, 2.6 percentage points fewer than the group average.
Compared with the other 32 NHL teams, Boston Bruins fans stand out for their interest in 98.5 The Sports Hub, Brad Marchand and David Pastrnak.
In Q3/2026, search interest was +3.0% on the same quarter a year earlier; the median across the group was +22.7%.
Interest is seasonal: January, March and April account for 43% of the year's searches, August is the quietest month.
Most fans live in Massachusetts, New Hampshire, Florida.
Top affinities include 98.5 The Sports Hub, Brad Marchand, David Pastrnak, with strongest over-indexing on 98.5 The Sports Hub (49.21× the country average).
Demographically, the Boston Bruins audience skews more male with an average age of 40.6, and over-indexes on personality traits such as Sports Activity, Community Orientation.
The typical Boston Bruins fan in United States is more male, around 40.6 years old, with strong Sports Activity tendencies and a notable affinity for 98.5 The Sports Hub.
At a glance
Search interest · 12-month trend
Demographics of Boston Bruins fans
32.1% are female, 67.9% are male, average age 40.6.
Gender split
| Metric | Value |
|---|---|
| Female | 32.1% |
| Male | 67.9% |
| Average age | 40.6 |
| Estimated audience size | 7.1M |
Age distribution
| Age bracket | Share | % |
|---|---|---|
| 16-24 | 21% | |
| 25-34 | 18% | |
| 35-44 | 18% | |
| 45-54 | 21% | |
| 55+ | 23% |
Worldwide distribution
of the worldwide Boston Bruins audience comes from United States.
| Country | Share |
|---|---|
| United States | 63.6% |
| Canada | 26.4% |
| Czech Republic | 1.6% |
Geography
Top regions by affinity
| # | Region | Reach | Affinity | × |
|---|---|---|---|---|
| 01 | New Hampshire | ~300K | 10.34× | |
| 02 | Maine | ~200K | 7.97× | |
| 03 | Massachusetts | ~1M | 7.82× | |
| 04 | Rhode Island | ~200K | 7.14× | |
| 05 | Vermont | ~70K | 4.82× | |
| 06 | Connecticut | ~100K | 1.96× | |
| 07 | Florida | ~300K | 0.57× | |
| 08 | New York | ~200K | 0.54× | |
| 09 | Alaska | ~8K | 0.52× | |
| 10 | South Carolina | ~50K | 0.44× | |
| 11 | Montana | ~9K | 0.39× | |
| 12 | Wyoming | ~5K | 0.38× | |
| 13 | North Carolina | ~90K | 0.37× | |
| 14 | Pennsylvania | ~90K | 0.34× | |
| 15 | Michigan | ~70K | 0.32× | |
| 16 | Colorado | ~40K | 0.32× | |
| 17 | Nevada | ~20K | 0.32× | |
| 18 | New Jersey | ~60K | 0.30× | |
| 19 | Virginia | ~50K | 0.30× | |
| 20 | North Dakota | ~5K | 0.30× | |
| 21 | Iowa | ~20K | 0.26× | |
| 22 | Delaware | ~5K | 0.26× | |
| 23 | Minnesota | ~30K | 0.25× | |
| 24 | South Dakota | ~5K | 0.25× | |
| 25 | Arizona | ~40K | 0.24× | |
| 26 | Utah | ~20K | 0.24× | |
| 27 | Ohio | ~60K | 0.22× | |
| 28 | Oregon | ~20K | 0.22× | |
| 29 | Idaho | ~8K | 0.22× | |
| 30 | Hawaii | ~7K | 0.22× | |
| 31 | Tennessee | ~30K | 0.21× | |
| 32 | West Virginia | ~8K | 0.21× | |
| 33 | Maryland | ~30K | 0.20× | |
| 34 | Nebraska | ~8K | 0.20× | |
| 35 | Georgia | ~40K | 0.19× | |
| 36 | Washington | ~30K | 0.19× | |
| 37 | Missouri | ~20K | 0.19× | |
| 38 | Wisconsin | ~20K | 0.19× | |
| 39 | Kentucky | ~20K | 0.19× | |
| 40 | Indiana | ~30K | 0.18× | |
| 41 | New Mexico | ~8K | 0.18× | |
| 42 | Oklahoma | ~10K | 0.17× | |
| 43 | Illinois | ~40K | 0.16× | |
| 44 | Kansas | ~10K | 0.16× | |
| 45 | Mississippi | ~10K | 0.15× | |
| 46 | Arkansas | ~9K | 0.15× | |
| 47 | Alabama | ~20K | 0.14× | |
| 48 | Louisiana | ~10K | 0.14× | |
| 49 | California | ~100K | 0.13× | |
| 50 | Texas | ~60K | 0.13× |
Affinity by region
Audience interests & affinities
Top cross-interests, ranked by affinity
| # | · | Interest | Category | Affinity | × |
|---|---|---|---|---|---|
| 01 | 98.5 The Sports Hub | Music & Radio | 49.21× | ||
| 02 | Brad Marchand | Sports | 45.00× | ||
| 03 | David Pastrnak | Sports | 36.34× | ||
| 04 | Connor McDavid | Sports | 29.57× | ||
| 05 | Boston Herald | News | 26.94× | ||
| 06 | Boston.com | Travel & Leisure | 20.87× | ||
| 07 | Winnipeg Jets | Sports | 20.51× | ||
| 08 | MBTA Commuter Rail | Cars & Mobility | 20.10× | ||
| 09 | Greater Boston | Travel & Leisure | 19.39× | ||
| 10 | Boston (magazine) | News | 18.95× | ||
| 11 | WCVB Channel 5 Boston | Movies & TV | 17.35× | ||
| 12 | Bill Belichick | Sports | 16.99× | ||
| 13 | DeMoulas Market Basket | Business & Career | 16.21× | ||
| 14 | Rob Gronkowski -Gronk | Person | 15.26× | ||
| 15 | USA Hockey | Sports | 10.59× | ||
| 16 | Market basket | Shopping | 9.51× | ||
| 17 | NHL (video game series) | Games | 9.36× | ||
| 18 | Montreal Canadiens | Sports | 8.80× | ||
| 19 | Boston Red Sox | Sports | 6.31× | ||
| 20 | New England Patriots | Sports | 4.89× |
Personality of the Boston Bruins audience
Deviation from the national baseline
| Trait | Cluster | Deviation | Score |
|---|---|---|---|
| Sports Activity | POWER | 1.08× | |
| Community Orientation | OPEN | 1.05× | |
| Patriotism | CONSERVATISM | 1.03× |
| Trait | Cluster | Deviation | Score |
|---|---|---|---|
| Urban Lifestyle | OPEN | 0.63× | |
| Indulgence | JOY | 0.65× | |
| Mindfulness | BALANCE | 0.68× |
Explore more audiences
More Ice hockey audiences in United States
- NHL (29,557,306)
- Minnesota Wild (9,431,193)
- Pittsburgh Penguins (8,424,384)
- Montreal Canadiens (7,291,099)
- Carolina Hurricanes (6,806,700)
Related rankings
Source & method
- Source
- Rascasse Solution, own modelling
- What “fans” means here
- Estimated number of people in United States with measurable interest in Boston Bruins over the last 12 months. Modelled, not counted; people interested in several teams count for each of them.
- Data basis
- Anonymised behavioural signals: search demand, social media signals, sponsorship and event data. Not a survey.
- Period
- 10/2025 – 09/2026 · updated quarterly · data status Q3/2026
- Confidence
- high gender and age data available and an audience of at least 100,000 people
Cite as: “Rascasse Solution, Q3/2026, rascasse.com/explore/us/boston-bruins-1677” · Methodology