Chick-fil-A Target Market in United States
Chick-fil-A has an estimated audience of 70.5M people in United States.
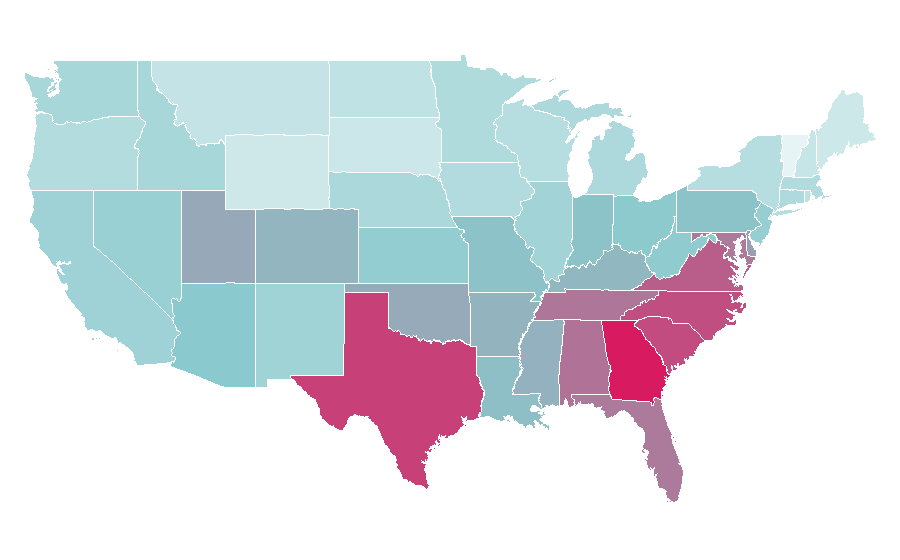
The average Chick-fil-A fan in United States is 40.1 years old, more female, and lives primarily in Texas.
By number of fans, Chick-fil-A ranks #1 among the 364 objects in Restaurants in United States — 15.8× the group median.
Compared with the other 363 objects in Restaurants, Chick-fil-A fans stand out for their interest in Five Guys, Sonic Drive-In and KFC.
Most fans live in Texas, California, Florida.
Top affinities include Popeyes Louisiana Kitchen, Raising Cane's Chicken Fingers, Zaxby's, with strongest over-indexing on Popeyes Louisiana Kitchen (5.42× the country average).
Demographically, the Chick-fil-A audience skews more female with an average age of 40.1, and over-indexes on personality traits such as Convenience Orientation, Patriotism.
The typical Chick-fil-A fan in United States is more female, around 40.1 years old, with strong Convenience Orientation tendencies and a notable affinity for Popeyes Louisiana Kitchen.
At a glance
Search interest · 12-month trend
Customer demographics of Chick-fil-A
57.8% are female, 42.2% are male, average age 40.1.
Gender split
| Metric | Value |
|---|---|
| Female | 57.8% |
| Male | 42.2% |
| Average age | 40.1 |
| Estimated audience size | 70.5M |
Age distribution
| Age bracket | Share | % |
|---|---|---|
| 16-24 | 21% | |
| 25-34 | 19% | |
| 35-44 | 18% | |
| 45-54 | 19% | |
| 55+ | 23% |
Worldwide distribution
of the worldwide Chick-fil-A audience comes from United States.
| Country | Share |
|---|---|
| United States | 88.8% |
| Canada | 4.8% |
| Puerto Rico | 1.5% |
Geography
Top regions by affinity
| # | Region | Reach | Affinity | × |
|---|---|---|---|---|
| 01 | Georgia | ~5M | 2.07× | |
| 02 | Texas | ~9M | 1.86× | |
| 03 | South Carolina | ~2M | 1.80× | |
| 04 | North Carolina | ~4M | 1.79× | |
| 05 | Virginia | ~3M | 1.70× | |
| 06 | Alabama | ~1.5M | 1.59× | |
| 07 | Tennessee | ~2.5M | 1.56× | |
| 08 | Florida | ~7M | 1.54× | |
| 09 | Maryland | ~2M | 1.54× | |
| 10 | Delaware | ~300K | 1.35× | |
| 11 | Utah | ~900K | 1.29× | |
| 12 | Oklahoma | ~1M | 1.28× | |
| 13 | Mississippi | ~800K | 1.24× | |
| 14 | Arkansas | ~800K | 1.23× | |
| 15 | Colorado | ~1.5M | 1.22× | |
| 16 | Kentucky | ~1M | 1.21× | |
| 17 | Louisiana | ~1M | 1.17× | |
| 18 | Missouri | ~1.5M | 1.15× | |
| 19 | Pennsylvania | ~3M | 1.14× | |
| 20 | Indiana | ~1.5M | 1.14× | |
| 21 | Arizona | ~2M | 1.10× | |
| 22 | Ohio | ~2.5M | 1.08× | |
| 23 | West Virginia | ~400K | 1.05× | |
| 24 | Washington, District of Columbia | ~100K | 1.03× | |
| 25 | Kansas | ~600K | 1.01× | |
| 26 | New Jersey | ~2M | 0.98× | |
| 27 | Nevada | ~600K | 0.95× | |
| 28 | California | ~7.5M | 0.89× | |
| 29 | New Mexico | ~400K | 0.88× | |
| 30 | Illinois | ~2.5M | 0.87× | |
| 31 | Washington | ~1.5M | 0.80× | |
| 32 | Idaho | ~300K | 0.80× | |
| 33 | Nebraska | ~300K | 0.77× | |
| 34 | Michigan | ~1.5M | 0.75× | |
| 35 | Hawaii | ~200K | 0.73× | |
| 36 | Connecticut | ~500K | 0.72× | |
| 37 | Minnesota | ~800K | 0.71× | |
| 38 | Massachusetts | ~1M | 0.70× | |
| 39 | Iowa | ~500K | 0.70× | |
| 40 | Oregon | ~600K | 0.68× | |
| 41 | New York | ~3M | 0.65× | |
| 42 | Wisconsin | ~800K | 0.65× | |
| 43 | Rhode Island | ~100K | 0.58× | |
| 44 | North Dakota | ~90K | 0.56× | |
| 45 | Montana | ~100K | 0.52× | |
| 46 | New Hampshire | ~100K | 0.49× | |
| 47 | South Dakota | ~80K | 0.44× | |
| 48 | Maine | ~100K | 0.43× | |
| 49 | Wyoming | ~50K | 0.41× | |
| 50 | Vermont | ~20K | 0.16× |
Affinity by region
Audience interests & affinities
Top cross-interests, ranked by affinity
| # | · | Interest | Category | Affinity | × |
|---|---|---|---|---|---|
| 01 | Popeyes Louisiana Kitchen | Food & Beverages | 5.42× | ||
| 02 | Raising Cane's Chicken Fingers | Food & Beverages | 5.28× | ||
| 03 | Zaxby's | Food & Beverages | 4.57× | ||
| 04 | Jack in the Box | Food & Beverages | 4.36× | ||
| 05 | Five Guys | Food & Beverages | 4.29× | ||
| 06 | Whataburger | Food & Beverages | 3.63× | ||
| 07 | Sonic Drive-In | Food & Beverages | 3.57× | ||
| 08 | Wendy's | Food & Beverages | 3.52× | ||
| 09 | Culver's | Food & Beverages | 3.47× | ||
| 10 | Arby's | Food & Beverages | 3.39× | ||
| 11 | Taco Bell | Food & Beverages | 3.31× | ||
| 12 | KFC | Food & Beverages | 3.20× | ||
| 13 | Burger King | Food & Beverages | 3.11× | ||
| 14 | Subway | Food & Beverages | 3.08× | ||
| 15 | Panera Bread | Food & Beverages | 2.93× | ||
| 16 | Panda Express | Food & Beverages | 2.83× | ||
| 17 | Chipotle Mexican Grill | Food & Beverages | 2.71× | ||
| 18 | Wingstop | Food & Beverages | 2.63× | ||
| 19 | Texas Roadhouse | Food & Beverages | 2.12× | ||
| 20 | McDonald's | Food & Beverages | 2.09× |
Personality of the Chick-fil-A audience
Deviation from the national baseline
| Trait | Cluster | Deviation | Score |
|---|---|---|---|
| Convenience Orientation | PREMIUM | 1.23× | |
| Patriotism | CONSERVATISM | 1.21× | |
| Price Sensitivity | PREMIUM | 1.20× |
| Trait | Cluster | Deviation | Score |
|---|---|---|---|
| Luxury Orientation | PREMIUM | 0.81× | |
| Design Affinity | PREMIUM | 0.87× | |
| Mindfulness | BALANCE | 0.91× |
Explore more audiences
More Restaurants audiences in United States
- Chipotle Mexican Grill (53,670,779)
- Texas Roadhouse (46,170,021)
- Raising Cane's Chicken Fingers (39,969,627)
- Little Caesars (37,383,401)
Source & method
- Source
- Rascasse Solution, own modelling
- What “fans” means here
- Estimated number of people in United States with measurable interest in Chick-fil-A over the last 12 months. Modelled, not counted; people interested in several brands count for each of them.
- Data basis
- Anonymised behavioural signals: search demand, social media signals, sponsorship and event data. Not a survey.
- Period
- 10/2025 – 09/2026 · updated quarterly · data status Q3/2026
- Confidence
- high gender and age data available and an audience of at least 100,000 people
Cite as: “Rascasse Solution, Q3/2026, rascasse.com/explore/us/chick-fil-a-10804” · Methodology