Raystown Lake Audience in United States
A data profile of the people who buy, follow and care about Raystown Lake in United States — modelled from more than twelve digital signal sources. Raystown Lake has an estimated audience of 62,817 people in United States.
The average Raystown Lake fan in United States is 42.4 years old, more female, and lives primarily in Pennsylvania.
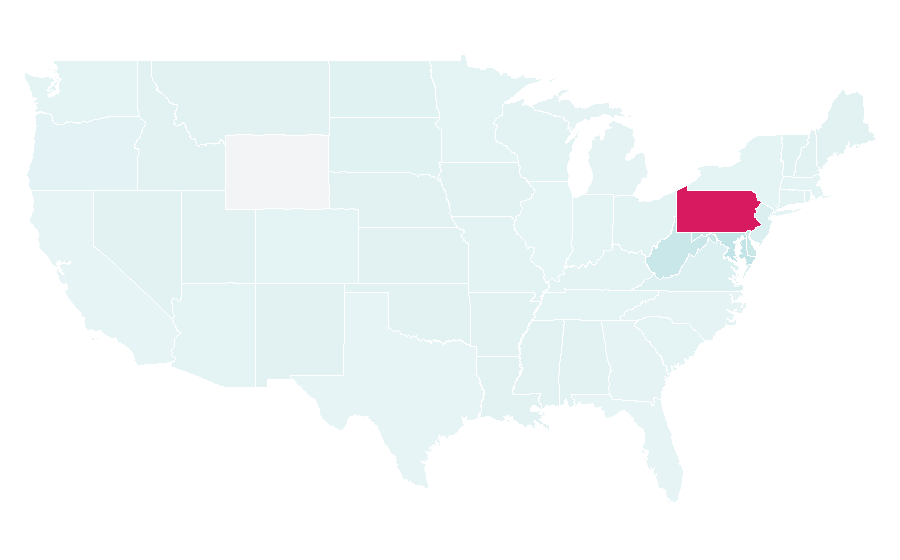
The audience is concentrated in Pennsylvania, Maryland, New Jersey.
Top brand affinities include Donald Trump, Rail transport, Dunkin' Donuts, with strongest over-indexing on Donald Trump (2.32× the country average).
Demographically, the Raystown Lake audience skews more female with an average age of 42.4, and over-indexes on personality traits such as Career Orientation, Tradition.
Compared to the country baseline, this audience shows distinctive patterns across 20 brand affinities and 50 regions tracked by Rascasse.
The typical Raystown Lake fan in United States is more female, around 42.4 years old, with strong Career Orientation tendencies and a notable affinity for Donald Trump.
At a glance
The key figures that characterise the Raystown Lake profile in United States.
Search interest · 12-month trend
Demographics of Raystown Lake fans
63.7% are female, 36.3% are male, average age 42.4.
Gender split
| Metric | Value |
|---|---|
| Female | 63.7% |
| Male | 36.3% |
| Average age | 42.4 |
| Estimated audience size | 62,817 |
Age distribution
| Age bracket | Share | % |
|---|---|---|
| 16-19 | 11% | |
| 20-29 | 15% | |
| 30-39 | 22% | |
| 40-49 | 30% | |
| 50+ | 21% |
Geography
Where the Raystown Lake audience in United States is strongest.
Top regions by affinity
| # | Region | Reach | Affinity | × |
|---|---|---|---|---|
| 01 | Pennsylvania | ~50K | 23.46× | |
| 02 | Maryland | ~5K | 4.63× | |
| 03 | West Virginia | ~1K | 3.95× | |
| 04 | Delaware | <1K | 3.83× | |
| 05 | Washington, District of Columbia | <1K | 1.88× | |
| 06 | New Jersey | ~3K | 1.61× | |
| 07 | Virginia | ~2K | 1.42× | |
| 08 | Alaska | <1K | 0.88× | |
| 09 | North Dakota | <1K | 0.87× | |
| 10 | Vermont | <1K | 0.87× | |
| 11 | South Dakota | <1K | 0.86× | |
| 12 | Montana | <1K | 0.85× | |
| 13 | Hawaii | <1K | 0.83× | |
| 14 | Rhode Island | <1K | 0.83× | |
| 15 | Mississippi | <1K | 0.82× | |
| 16 | New Mexico | <1K | 0.82× | |
| 17 | Nebraska | <1K | 0.82× | |
| 18 | Arkansas | <1K | 0.81× | |
| 19 | Idaho | <1K | 0.81× | |
| 20 | Louisiana | <1K | 0.79× | |
| 21 | Kansas | <1K | 0.79× | |
| 22 | Iowa | <1K | 0.78× | |
| 23 | New Hampshire | <1K | 0.78× | |
| 24 | Maine | <1K | 0.78× | |
| 25 | Oklahoma | <1K | 0.76× | |
| 26 | Nevada | <1K | 0.76× | |
| 27 | Utah | <1K | 0.75× | |
| 28 | Alabama | <1K | 0.74× | |
| 29 | Oregon | <1K | 0.71× | |
| 30 | Wisconsin | <1K | 0.68× | |
| 31 | Ohio | ~1K | 0.66× | |
| 32 | Kentucky | <1K | 0.66× | |
| 33 | Missouri | <1K | 0.61× | |
| 34 | Connecticut | <1K | 0.61× | |
| 35 | Arizona | <1K | 0.59× | |
| 36 | Washington | <1K | 0.59× | |
| 37 | Minnesota | <1K | 0.59× | |
| 38 | New York | ~2K | 0.58× | |
| 39 | South Carolina | <1K | 0.58× | |
| 40 | Tennessee | <1K | 0.56× | |
| 41 | Indiana | <1K | 0.55× | |
| 42 | Colorado | <1K | 0.53× | |
| 43 | Massachusetts | <1K | 0.48× | |
| 44 | Michigan | <1K | 0.47× | |
| 45 | North Carolina | <1K | 0.46× | |
| 46 | Georgia | <1K | 0.43× | |
| 47 | Illinois | <1K | 0.41× | |
| 48 | Florida | ~1K | 0.34× | |
| 49 | Texas | ~2K | 0.32× | |
| 50 | California | ~2K | 0.29× |
Affinity by region
Audience interests & affinities
The strongest cross-interests of the Raystown Lake audience — brands, topics and people combined.
Top cross-interests, ranked by affinity
| # | · | Interest | Category | Affinity | × |
|---|---|---|---|---|---|
| 01 | Pittsburgh Penguins | Sports | 7.70× | ||
| 02 | Garden centre | Home & Garden | 6.73× | ||
| 03 | Rail transport | Travel & Leisure | 5.02× | ||
| 04 | Dunkin' Donuts | Food & Beverages | 4.42× | ||
| 05 | Pub | Food & Beverages | 4.35× | ||
| 06 | Pittsburgh Steelers | Sports | 4.06× | ||
| 07 | Hardware store | Home & Garden | 3.60× | ||
| 08 | Theme parks | Travel & Leisure | 2.87× | ||
| 09 | Donald Trump | Politics & Society | 2.32× | ||
| 10 | Wine | Food & Beverages | 2.31× | ||
| 11 | Barbecue | Food & Beverages | 2.27× | ||
| 12 | Beer | Food & Beverages | 2.26× | ||
| 13 | Country music | Music & Radio | 2.26× | ||
| 14 | Internet & Social Media | 2.18× | |||
| 15 | Recipes | Food & Beverages | 2.07× | ||
| 16 | Alcoholic beverages | Food & Beverages | 2.05× | ||
| 17 | Home improvement | Home & Garden | 2.03× | ||
| 18 | Furniture | Home & Garden | 2.03× | ||
| 19 | Walmart | Shopping | 1.99× | ||
| 20 | Cooking | Food & Beverages | 1.88× |
Personality of the Raystown Lake audience
Values above 1.00× are above the country average, values below 1.00× below it.
Deviation from the national baseline
| Trait | Cluster | Deviation | Score |
|---|---|---|---|
| Career Orientation | POWER | 1.98× | |
| Tradition | CONSERVATISM | 1.98× | |
| Need for Security | CONSERVATISM | 1.89× |
| Trait | Cluster | Deviation | Score |
|---|---|---|---|
| Luxury Orientation | PREMIUM | 0.30× | |
| Mindfulness | BALANCE | 0.56× | |
| Risk Appetite | THRILL | 0.57× |
Frequently asked questions
How many fans does Raystown Lake have in United States?
Raystown Lake has an estimated audience of 62,817 people in United States, concentrated in Pennsylvania and Maryland.
What is the gender split and age of Raystown Lake fans?
63.7% of Raystown Lake fans are female, 36.3% are male, with an average age of 42.4 years.
Which brands do Raystown Lake fans like most?
Raystown Lake fans show strongest brand affinity for Donald Trump (2.32×), Rail transport (5.02×), and Dunkin' Donuts (4.42×) over the country average.
Where do Raystown Lake fans live in United States?
Raystown Lake fans in United States are most concentrated in Pennsylvania (reach ~50K), Maryland (reach ~5K), and New Jersey (reach ~3K). These three regions account for the largest share of the active audience.
What other brands do Raystown Lake fans also like?
Beyond Raystown Lake itself, the audience over-indexes on Rail transport (5.02×), Dunkin' Donuts (4.42×), Cooking (1.88×), and Alcoholic beverages (2.05×) compared to the United States average.
Explore more audiences
Related profiles, rankings and the same audience in other markets.
More Lake audiences in United States
- Lake Michigan (5,970,640)
- Lake Erie (1,822,285)
- Lake Superior (1,095,806)
- Tidal Basin (877,688)
- Lake Union (868,239)
See Raystown Lake audiences in other countries
- Raystown Lake — Germany
- Raystown Lake — United Kingdom
- Raystown Lake — Italy
- Raystown Lake — Spain
- Raystown Lake — Brazil
- Raystown Lake — France
- Raystown Lake — Canada
- Raystown Lake — Mexico
- Raystown Lake — Netherlands
- Raystown Lake — Austria
- Raystown Lake — Belgium
- Raystown Lake — Portugal
- Raystown Lake — Ireland
- Raystown Lake — Argentina
- Raystown Lake — Sweden
- Raystown Lake — Norway
- Raystown Lake — Finland
- Raystown Lake — Denmark
- Raystown Lake — India
- Raystown Lake — Colombia
- Raystown Lake — Australia
- Raystown Lake — South Africa
- Raystown Lake — Poland
- Raystown Lake — Malaysia
- Raystown Lake — Switzerland
- Raystown Lake — United Arab Emirates
- Raystown Lake — Indonesia
- Raystown Lake — Japan
- Raystown Lake — South Korea
- Raystown Lake — Saudi Arabia
How to read this data
Audience size is the estimated number of people in United States who actively search for Raystown Lake. Affinity is an over-index ratio: 2.0× means the audience is twice as likely to engage with that brand or trait as the country average. Reach is the estimated number of audience members in a region. Regional and brand-affinity tables are sorted from strongest signal to weakest.
About this audience profile
This audience profile is generated by Rascasse from anonymized search-behavior signals across United States. For methodology see methodology. Affinity values are over-index ratios vs. the country average (1.0 = baseline). Audience sizes are estimated, not measured.
Source: Rascasse Audience Intelligence — modeled from anonymized, multi-source behavioral signals (search, social, events), updated monthly. Data status: 09/2026.
From global mass-market brands to niche local segments — explore the full library and see which intelligence layers are included.