
Home / Brand & Market Share / Share of Search & Market Share
Share of Search & Brand Tracking · for brands, agencies and rights holders
Your share of demand. Ten years back, every market.
Share of search is your share of all searches in your category, and it moves with market share. Rascasse tracks it for any brand, up to ten years back, with the same method in every country, and explains every spike with 4.1 million events.
- 10 years of history
- 4.1M events explain the spikes
- Same method worldwide
Used by brands, agencies, media and rights holders










Why share of search
People search before they buy. Search share leads market share.
Share of search has been shown to track market share and to move ahead of it. It is cheap to measure, comparable across countries and available every month, unlike brand trackers built on surveys.
- Share: your searches divided by the category’s
- Trend: month by month, up to ten years back
- Events: 4.1 million matches, launches, releases and holidays to explain the spikes
What slows you down
Brand tracking that comes too late
Brand trackers cost a lot and arrive quarterly.
Numbers do not compare across markets.
A jump in demand, but why?
Your number alone tells little.
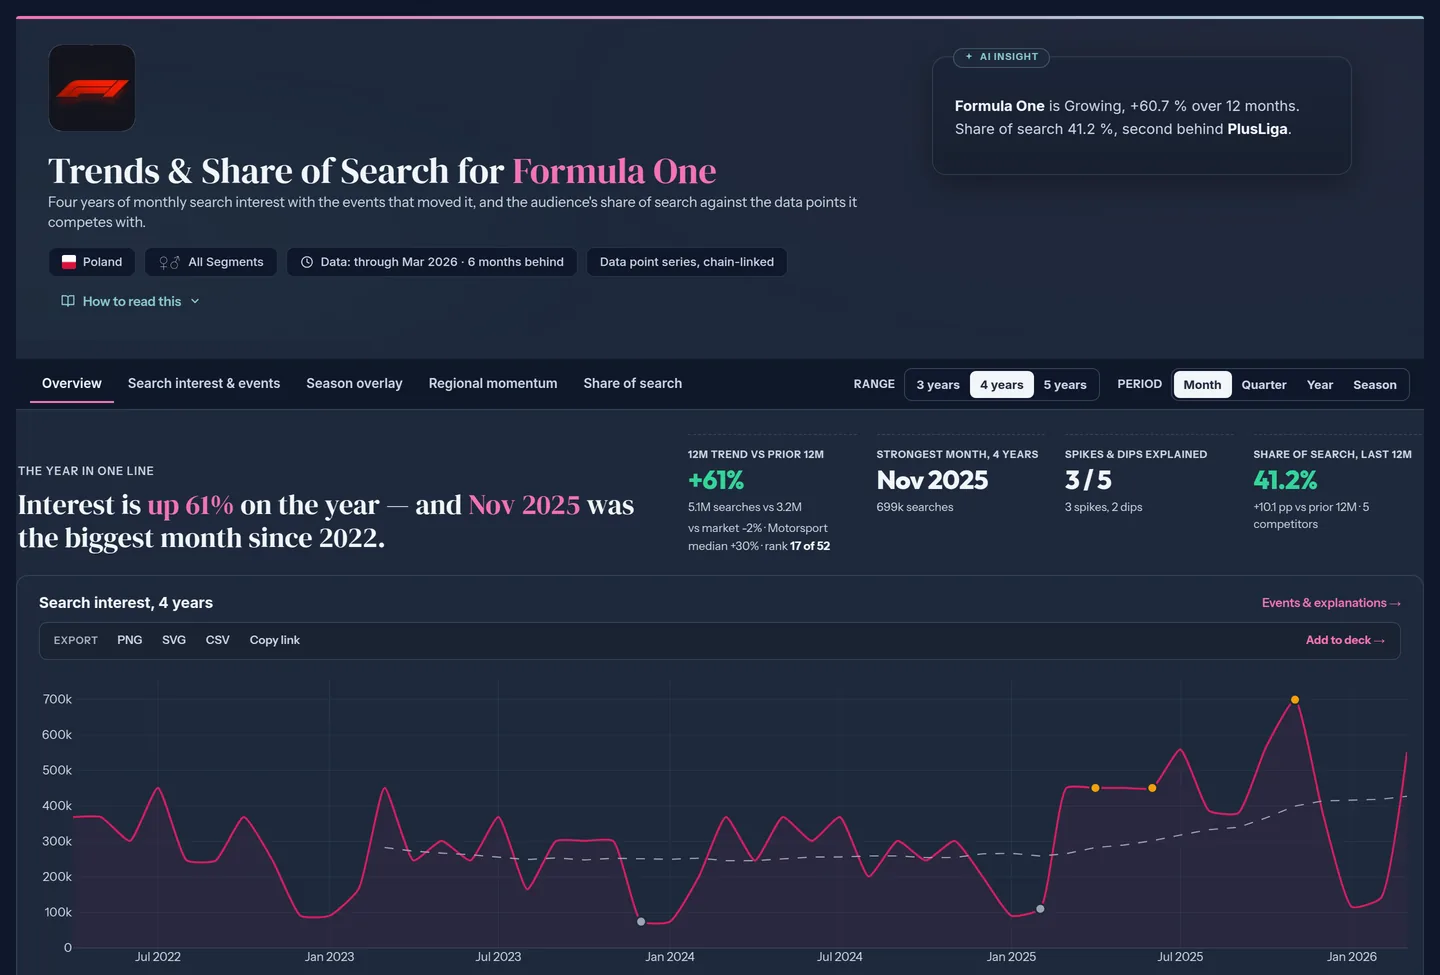
Interest, trend and the year in one line
Formula One in Poland: interest up 61 % on the year, November 2025 the biggest month since 2022.
- Four years and more
- Year on year
- Biggest months
Your share against competitors
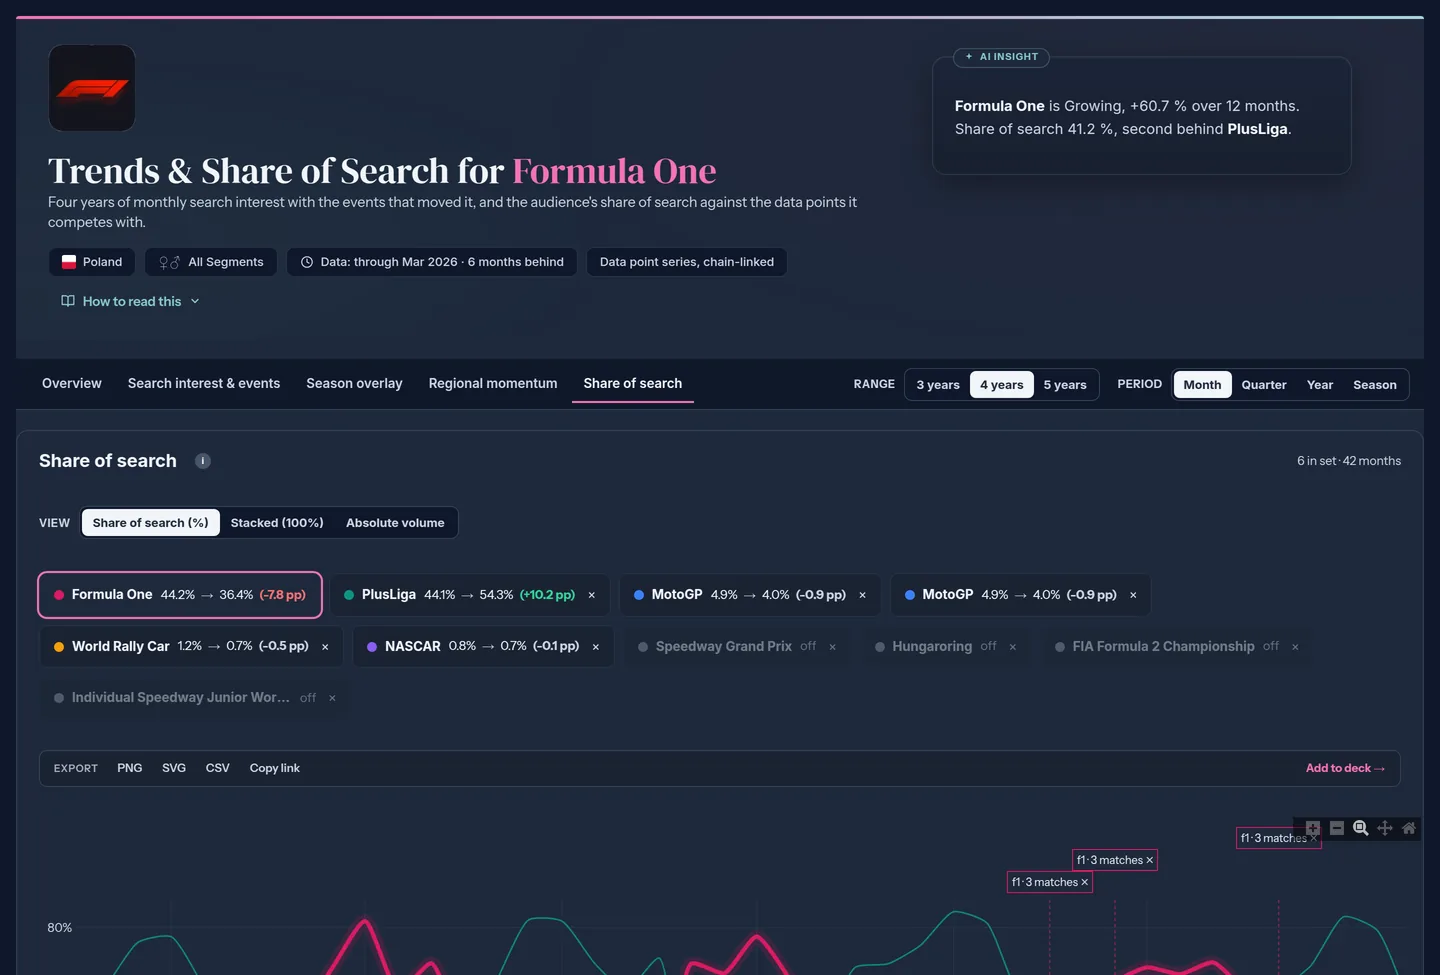
Formula One’s share of search in Poland is 41.2 %, second behind the volleyball league PlusLiga. Every competitor on the same chart.
41.2 % share of search, second behind PlusLiga.
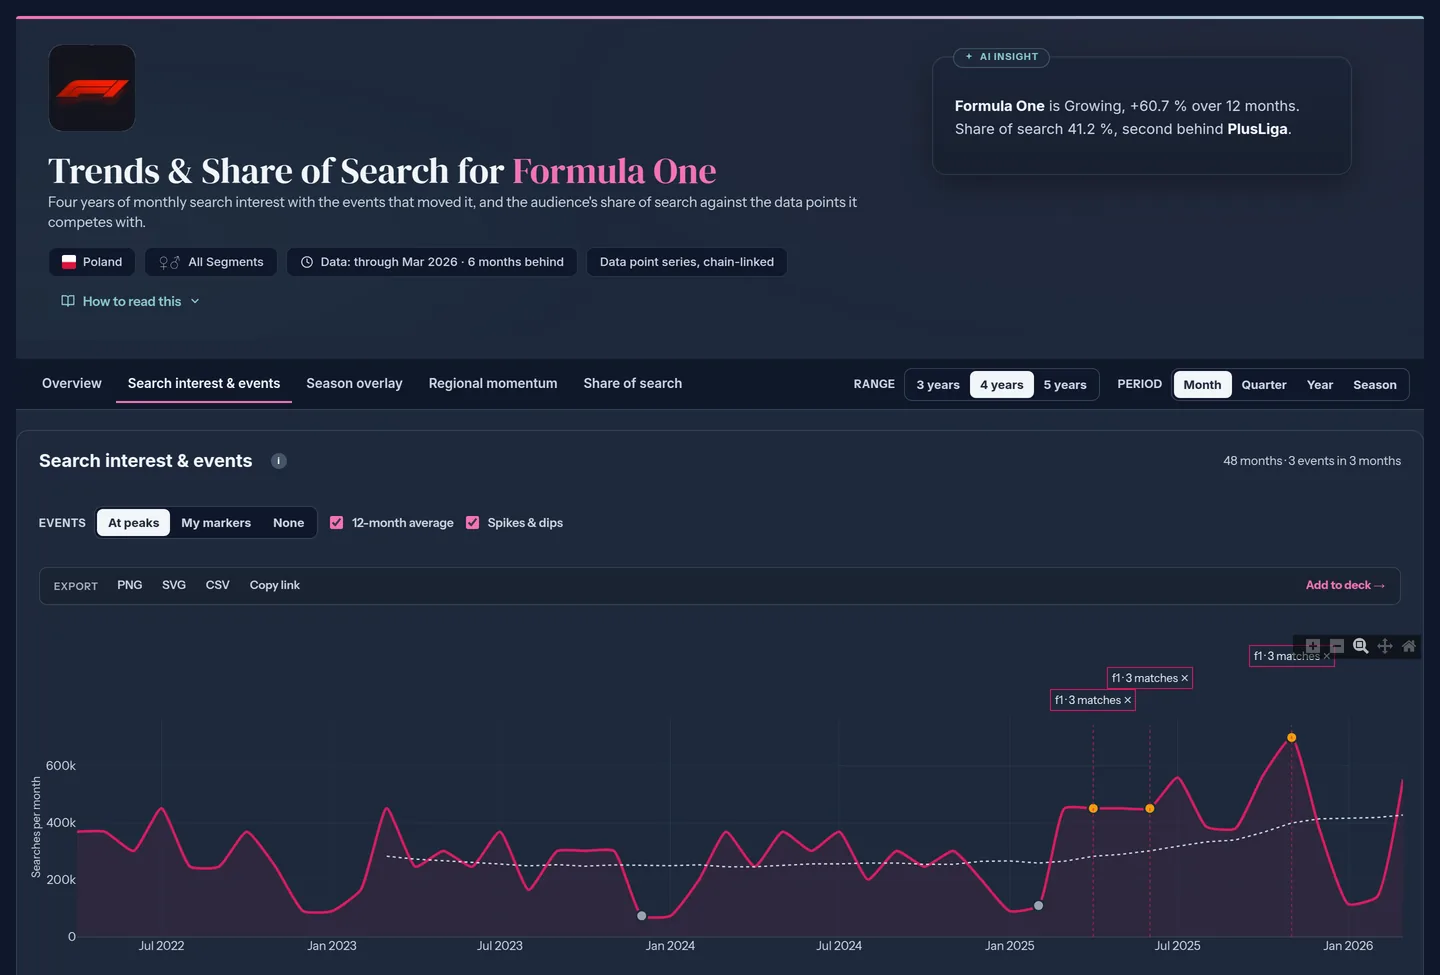
Every spike matched with events: races, launches, news.
Brand tracking without a survey
Track your brand every quarter in every market: awareness through search, share against competitors and the regions where it moves, as a continuous tracker instead of a quarterly survey.
Rascasse inside Claude and ChatGPT
Connect Rascasse to your AI assistant through MCP and track your share in conversation.
- Works with Claude, ChatGPT and other MCP clients
- Any brand, any category, any market
- Available as part of your agreement, API included
Share of search, last twelve months:
| Signal | Value |
|---|---|
| Share of search | 41.2 % |
| Rank | 2nd, behind PlusLiga |
| Interest | +60.7 % year on year |
Strong growth: November 2025 was the biggest month since 2022.
What you get
Market share you can see every month
Comparing the whole industry and its cities? See Competitive Intelligence.
Start small
Start with a Proof Case
Your brand and three competitors, share of search in one market, ten years back, with the events behind the spikes. A fixed scope and a fixed price, presented to the people who decide, and credited against the Annual fee if you continue.
Every month without tracking is a month you cannot compare later.
Questions
Before you ask
How far back?
Up to ten years, depending on the signal.
What explains the spikes?
An event database with 4.1 million entries: matches, launches, releases, holidays and news.
Where does the data come from?
From AI-based analysis of aggregated digital behaviour signals, not surveys: what people search, follow, watch and listen to, aggregated and anonymous. No panels and no questionnaires.
Is this personal data?
No. We work with aggregated signals only: no names, no e-mail addresses, no individual profiles.
More in Brand & Market Share